Proceedings of the 28th Meeting
Working Group on Prolamin Analysis
and Toxicity (PWG)
Edited by Peter Koehler
German Research Centre for Food Chemistry, Freising
Verlag Deutsche Forschungsanstalt für Lebensmittelchemie - 2015
Preface
The 28th meeting of the Working Group on Prolamin Analysis and Toxicity (PWG) was held in Nantes (France) from 25th to 27th of September, 2014. The hosts were
Olivier Tranquet, Laurie Brard, Colette Larré, and Sandra Denery from the allergy
research group at INRA in Nantes. Among the 13 members of the PWG, nine
participated in person, two were replaced by colleagues from their institutes, and two
were not able to participate. Because of a strike of the Air France pilots, several people
were not able to get to Nantes. The audience comprised 60 persons that included one
invited speaker and guests from coeliac societies, academia, and industry. The latter
was represented by starch producers, manufacturers of gluten-free foods, and
producers of test kits for the analysis of gluten in food as well as for diagnostic
antibody assays.
As agreed by the PWG in 2013, a symposium was held on antigen receptors in coeliac
disease comprising two presentations of recognised experts in this field. In addition,
two presentations were dedicated to research on coeliac disease and wheat allergy in
France. The analytical and clinical sessions featured in total 14 presentations covering
aspects from gluten analysis, gluten modification by technology or breeding, serology,
pathochemistry, and detection of gluten fragments in human stools.
I would like to express my gratitude to all participants for their contributions and
discussions during the meeting. Furthermore, I would like to express my warm thanks
to the local organising team, in particular Laurie Brard and Olivier Tranquet for having
organised a perfect meeting. This book would not have been possible without the help
of Katharina Scherf who made an excellent job in proofreading of the manuscript. Last
but not least, I would like to express my appreciation to all friends, colleagues, and
sponsors for their ongoing support of the meeting.
Freising, April, 2015 Peter Koehler
1. Executive Summary
Among the topics of the meeting were antigen receptors in coeliac disease, analytical
issues of gluten, diagnosis of coeliac disease, and further aspects of the
pathomechanism.
Analytical session
The analytical session was comprised of nine presentations that mainly addressed
analytical methods for gluten quantitation, and it appears that progress is being made
in the analysis of partially deamidated gluten. Two papers addressed breeding and
genetic initiatives on reducing coeliac activity of wheat. One presentation was dealing
with reduction or abolishment of coeliac toxicity by chemical oxidation.
Clinical session
Five presentations were given in the clinical session. The first part of the session
addressed the use of serology in the diagnosis of coeliac disease. Another two topics
were related to the pathomechanism of coeliac disease, and finally, there was one
presentation on the presence of coeliac-active gluten peptides in human stool samples.
Two extra presentations apart from the regular clinical session gave a comprehensive
overview on the research activities in France related to coeliac disease and wheat
allergy.
Symposium: Antigen receptors in coeliac disease
The symposium included two presentations of recognized experts in this field of
research. The presentations impressively showed the progress that has been made in
relation to explaining the role of T cells in the pathomechanism and to using them as
diagnostic tools in coeliac disease. An exciting new technique, referred to as mass
cytometry (“CyTOF”), has a tremendous potential for mapping multiple markers of
coeliac and related diseases.
4. Analytical research reports
4.1 Complementarity of native and deamidated gluten
detection with R5 and INRA-DG1 mAbs
Olivier Tranquet, Roberta Lupi, Colette Larré, Sandra Denery
INRA, UR1268 Biopolymers, Interactions, Assemblies, Nantes, France
Introduction
Diversification of gluten applications was achieved through the production of watersoluble
gluten also named wheat isolates. Deamidation, one of the methods for this
purpose, may be obtained with either chemical (acid or alkali) or enzymatic treatment
and lead to the conversion of glutamine and asparagine into glutamic and aspartic
acids. These types of products can be found in both cosmetics and food.
Since the 2000s, severe allergic reactions to deamidated gluten (DG) have been
reported in individuals although they were tolerant to native wheat protein [1]. In
Japan, five women, who exhibited a particular and severe food allergy to wheat after
sensitisation by a soap containing acid-hydrolysed gluten, were described in 2011 [2].
In 2013, more than 1,300 people had been sensitised by the same soap and exhibited
severe symptoms after wheat ingestion [3]. Management of these allergies is extremely
difficult both for patient and food manufacturers. Therefore, for clinical purposes a
wheat isolate was proposed for skin-prick-tests [4]. More recently, the identification of
several epitopes linked to this allergy drove to conclude to a new type of allergy
specifically elicited by DG [5]. One of these epitopes (QPEEPFPE), derived from a
repetitive sequence of 2- and -gliadins, was shown to be dominant.
Most of the gluten detection methods rely on antibodies that target domains of gliadins
containing repetitive sequences. These glutamine-rich domains are likely to be
modified by deamidation. Kanerva et al. demonstrated that analytical methods based
on R5, on Skerritt’s or on G12 monoclonal antibodies (mAbs) were not efficient for
recognising DG [6]. To fill this gap, mouse monoclonal antibodies were produced
against the peptide LQPEEPFPEQC. They were characterised by immunochemical
methods with purified gliadins. mAb INRA-DG1 specifically bound deamidated
gluten with high affinity and without any reaction to native wheat gluten. A
competitive ELISA assay to detect deamidated gluten was developed with mAb
INRA-DG1 [7]. Analysis of native and deamidated glutens with R5 and INRA-DG1
competitive assay suggested a good complementarity of these two antibodies for
gluten detection whatever its deamidation status.
In this work, we have detailed this complementarity at the epitopic level and evaluated
the compatibility of the INRA-DG1 competitive assay with an extraction procedure
designed for native gliadins.
Materials and methods
Pepscan was carried out according to Denery et al. [5] with peroxidase-conjugated R5
mAb taken out of RIDASCREEN® Gliadin competitive kit (R-Biopharm, Germany)
and diluted 1/20 in 2.5% (w/v) skimmed dried milk and 5% (w/v) sucrose in trisbuffered
saline TBS.
Competitive INRA-DG1 ELISA
Microtiter plates (Maxisorp, NUNC, Roskilde, Denmark) were coated with
LQPEEPFPEQC conjugated to BSA in 10 mmol/L carbonate-bicarbonate buffer (pH
9.6) and left overnight at 4 °C. 5 g of rice flour samples were suspended in 10 mL of
phosphate-buffered saline (PBS) or of Mendez cocktail [8] and incubated 40 min at 50 °C, then 40 mL of PBS or of a 80% ethanol solution was added and incubated for 1h at
RT. Supernatants were collected by centrifugation at 2,500 g and further diluted 1/20
in PBS containing 0.1% skimmed milk prior incubation with INRA-DG1 mAb (crude
supernatant diluted at 1/4,000) for 2 h at 37 °C. Then, 100 μL of antibody sample
solution was added to plates coated in BSA-LQPEEPFPEQC and incubated for 1 h.
After washing, bound mAbs were revealed by incubation with horseradish peroxidase
anti-mouse IgG (170-6516, Bio-Rad, 1/3,000 dilution) and orthophenylenediamine
(Sigma) as the substrate. Colour development was stopped with 100 μL of 2 mol/L
H2SO4 and the absorbance was read at 492 nm. Inhibition of antibody binding was
expressed as the percentage of the maximal response obtained with antibody in the
absence of the competitor according to the following formula:
% inhibition = 1 - (sample OD/ blank sample OD)
Industrially deamidated gluten (heated under acidic conditions) was used as standard
and for rice flour contamination. Spiked rice flour: 5 g of rice flour was spiked with
100 μg of deamidated gluten.
Results and discussion
In our recent work, we have shown that R5 and INRA-DG1 exhibited complementary
reactivity toward native and deamidated glutens [7]. INRA-DG1 reactivity on peptides
from the repetitive sequences of 2- or -gliadins deamidated at different levels was
determined by the pepscan technique and the epitopic sequences of INRA-DG1 mAb
were found to be Q/EPQ/EEPFPE. The same pepscan membrane was used to compare
the reactivity of R5 mAb with the INRA-DG1 mAb (Fig. 1). Peptides 2 to 9
corresponded to the Ala scan of the peptide QPQQPFPQ from native 2- or -gliadin
(peptide 1). Analysis of the R5 reactivity on these nine peptides revealed a minimal
consensus epitope of R5 as QQA/PFP. In accordance with Osman et al. [9], Pro in
position 2 or 5 and Gln in the first or in the last position could be replaced by Ala
without impacting R5 binding. In addition, the capacity of both antibodies (INRA DG1 and R5) to bind to the same peptide with its Gln more or less substituted by Glu
(Fig. 1 lane 10 to 24) was examined. Although R5 was tolerant to Gln/Ala substitution
in the first or in the last position of peptide 1, the Gln/Glu substitution at these
positions reduced the R5 binding (peptide 10 and 13). This reduction was strengthened
with a double substitution, since the R5 binding was almost fully abolished with
peptide 16. All other Gln/Glu substitutions were detrimental for R5 binding.
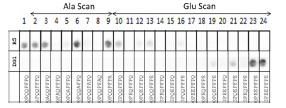
Figure 1. Reactivity of INRA-DG1 and R5 mAbs on octapeptides synthesised on
cellulose membrane. 1 original peptide; Ala Scan: 2 - 9 Ala substitution at each amino
acid position; Glu Scan: 10 - 24 Gln/Glu substitutions
This result obtained at the epitopic level confirmed that R5 and INRA-DG1 mAbs did
not bind the same epitopes and that there was no overlap between them.
Numerous tests for the detection of gluten are available; those using the R5 antibody
are recommended by the Codex Alimentarius. The analysis of several wheat isolates
showed that they could be more or less deamidated and in a number of cases, they
escaped detection by R5 kit. Faced with a sample with a putative gluten
contamination, the analyst cannot know whether the gluten is deamidated or not.
Simultaneous analysis of the sample with R5 and INRA-DG1 mAbs was considered
and the compatibility of the extraction buffer used in the R5 methods was tested in the
INRA-DG1 competitive ELISA. Native gliadins are usually solubilised in ethanol with
or without a preliminary extraction step in solutions containing denaturant and
reducing agents such as in the Mendez cocktail. On the other hand, DG was extracted
in aqueous buffer such as PBS. Rice flour samples spiked with DG at 20 mg/kg were
extracted in PBS, in Mendez cocktail + ethanol or in Mendez cocktail + PBS. Samples
were then analysed in the INRA-DG1 competitive assay and inhibition percentages
were calculated (Fig. 2). Whatever the extraction conditions, no cross-reaction was
observed with unspiked rice flour samples. Analysis of samples spiked at 20 mg/kg
resulted in significant inhibition (Fig. 2). The test allowed the determination of the DG
content, the results varied slightly according to extraction conditions. Recovery rates
were 100%, 107%, and 129% for extraction in PBS, in Mendez cocktail + EtOH, or in
Mendez cocktail + PBS, respectively.
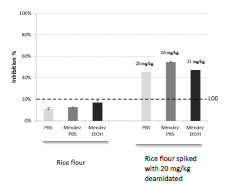
Figure 2. Detection of deamidated gluten in rice flour spiked at 20 mg/kg after
extraction with PBS or with cocktail Mendez. LOD, Limit of detection
Conclusions
Among the gliadins, R5 mAb bound - and 2-gliadins strongly [10]. Deamidation of
gluten induced Gln/Glu substitution and impaired its detection by R5. In this study, we
have shown the impact of Gln/Glu substitution on R5 binding to peptides deduced
from the repetitive sequences of - and 2-gliadins, highlighting that Gln/Glu
substitutions inside the R5 epitopes and in the flanking amino acids are detrimental.
On the contrary, INRA-DG1 is able to detect these deamidated epitopes pointing out
the interest of INRA-DG1 mAb to complete the tools available for reliable gluten
detection.
Aknowledgment
We thank Valerie Echasserieau and Manon Beltrando for their technical assistance and
INRA Transfer for its funding.
References
1. Leduc V, Moneret-Vautrin DA, Guerin L, et al. Anaphylaxis to wheat isolates:
immunochemical study of a case proved by means of double-blind, placebocontrolled
food challenge. J Allergy Clin Immun 2003; 111: 897-899.
2. Fukutomi Y, Itagaki Y, Taniguchi M, et al. Rhinoconjunctival sensitization to
hydrolyzed wheat protein in facial soap can induce wheat-dependent exerciseinduced
anaphylaxis. J Allergy Clin Immun 2011; 127: 531-533.
3. Chinuki Y, Morita E. Wheat-dependent exercise-induced anaphylaxis sensitized
with hydrolyzed wheat protein in soap. Allergol Int 2012; 61: 529-537.
4. Battais F, Denery-Papini S, Moneret-Vautrin D-A, et al. Wheat flour allergy: an
entire diagnostic tool for complex allergy. Eur Ann Allergy Clin Immunol 2006;
38: 59-61.
5. Denery-Papini S, Bodinier M, Larré C, et al. Allergy to deamidated gluten in
patients tolerant to wheat: specific epitopes linked to deamidation. Allergy 2012;
67:1023-1032.
6. Kanerva PM, Brinck O, Sontag-Strohm TS, et al. Deamidation of gluten proteins
and peptides decreases the antibody affinity in gluten analysis assays. J Cereal Sci
2011; 53: 335-339.
7. Tranquet O, Larré C, Denery-Papini S. et al. Characterization of antibodies and
development of an indirect competitive immunoassay for detection of deamidated
gluten. J Agric Food Chem 2015; submitted.
8. Garcia E, Wieser H, Mendez E. et al. Development of a general procedure for
complete extraction of gliadins for heat processed and unheated foods. Eur J
Gastroenterol Hepatol 2005; 17: 529-539.
9. Osman AA, Mendez E, Mothes T. et al. A monoclonal antibody that recognizes a
potential coeliac-toxic repetitive pentapeptide epitope in gliadins. Eur J
Gastroenterol Hepatol 2001; 13: 1189-1193.
10. Tranquet O, Larré C, Denery-Papini S. Selection of a monoclonal antibody for
detection of gliadins and glutenins: A step towards reliable gluten quantification. J
Cereal Sci 2012; 56: 760-763.
4.2 Collaborative study on gluten detection using the
RIDA®QUICK Gliadin dipstick
Katharina Scherf1, Peter Koehler1, Thomas Weiss2, Steffen Uhlig3, Markus Lacorn2
1 Deutsche Forschungsanstalt für Lebensmittelchemie, Leibniz Institute, Freising,
Germany
2 R-Biopharm AG, Darmstadt, Germany
3 QuoData GmbH, Dresden, Germany
Introduction
Currently, the only known effective treatment for coeliac disease (CD) is a lifelong
gluten-free diet, which should contain less than 20 mg gluten per day to prevent a
relapse of intestinal symptoms [1]. The Codex Alimentarius and legislation in the
United States, Canada, and Europe endorse a threshold of 20 mg gluten/kg for glutenfree
foods [2]. To guarantee the safety of gluten-free products for CD patients, specific
and sensitive analytical methods are needed. Immunologic methods based on specific
antibodies are recommended for the determination of gluten in foods. The R5
monoclonal antibody primarily recognises the epitope QQPFP, which is present in
gliadins, secalins, and hordeins and occurs in many CD-toxic or -immunogenic
peptides [3]. Sandwich and competitive ELISA formats based on the R5 antibody were
successfully validated as AACC International Approved Method 38-50.01 for intact
gluten [4] and 38-55.01 for partially hydrolysed gluten [5], respectively. Additionally,
the R5 Sandwich ELISA is endorsed by the AOAC International as Official Method of
Analysis first action status 2012.01 and laid down as a Codex Type 1 Method for the
analysis of gluten [6].
Immunochromatographic assays, available as lateral flow devices or dipsticks, provide
rapid qualitative results indicating the presence or absence of the substance to be
determined. The RIDA®QUICK Gliadin dipstick based on the R5 antibody is intended
to be used as a swab test of potentially contaminated surfaces or to check for gluten
contamination of raw materials after ethanol extraction or of processed materials after
cocktail extraction [7].
Following the guidelines for validation of qualitative binary chemistry methods of the
AOAC International Stakeholder Panel on Alternative Methods (ISPAM) [8], an
international collaborative study was set up to validate the R5 dipstick (RIDA®QUICK
Gliadin, R7003, R-Biopharm) for qualitative gliadin/gluten detection in raw and
processed food materials as an AACC International Approved Method.
Materials and methods
The R5 dipstick test kit for the detection of gliadin in raw and processed food (RIDA® QUICK Gliadin, R7003, R-Biopharm) was used in this study together with the cocktail
solution for part B of this collaborative test (cocktail (patented), R7006, R-Biopharm).
Two sets of assay controls (R7010 and R7012, R-Biopharm) for use with the ethanol
extraction or the cocktail extraction were also provided.
Participating laboratories
Eighteen laboratorie (designated A to W) participated in the collaborative study: one
each in Argentina, Austria, Belgium, Canada, Finland, Hungary, Ireland, Italy,
Sweden, Switzerland, and the United Kingdom; three in Germany and four in the
United States. All laboratories had previous experience with immunological tests and
were advised to use a clean, separate room due to the possibility of gluten
contamination. The laboratories were given four weeks each to perform the analyses
for part A and for part B.
Samples and sample presentation
Due to the two different extraction protocols, the collaborative test was split into two
parts (A and B) with four samples and ten replicates, respectively. All concentrations
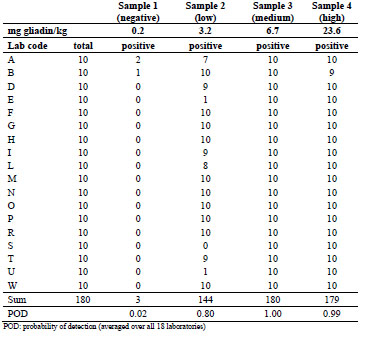
were determined using the RIDASCREEN® Gliadin R7001 (R-Biopharm) (Tab. 1).
Table 1. Samples for part A (unprocessed samples with ethanol extraction) and part B
(processed samples with cocktail extraction) of the collaborative study.
 All samples were checked for homogeneity using the RIDASCREEN® Gliadin R7001
(R-Biopharm) according to the IUPAC recommendations for proficiency tests [9]. Ten
blinded replicates for each sample [8] were provided to each participating laboratory.
All samples were checked for homogeneity using the RIDASCREEN® Gliadin R7001
(R-Biopharm) according to the IUPAC recommendations for proficiency tests [9]. Ten
blinded replicates for each sample [8] were provided to each participating laboratory.
The samples were marked with a laboratory-specific letter (A to W), an “E” for
ethanol extraction (part A) or a “C” for cocktail extraction (part B) and a randomised
number from 1 to 40.
Method and qualitative evaluation
The method and a training video were provided to each laboratory with the
instructions to follow the method as written with no deviations. All results obtained by
visual inspection after comparison to an evaluation card had to be recorded in a ready to-use Excel sheet. First, possible sources of contamination, such as containers and
surfaces, the cocktail solution, the 60 or 80% ethanol solution, and the dilution buffer
were checked for gluten contamination using the dipsticks. Then, two sets of assay
controls with known concentrations were analysed to ensure proper familiarisation
with the test. Finally, each blind-coded sample (in total 80 samples) was extracted
once and analysed according to the instructions. Each sample had to be marked either
as positive, negative or invalid. In case of an invalid result (missing control line or
incomplete target line), retesting of the sample was requested.
Results and discussion
The results for each laboratory and sample are shown in Tab. 2 (part A with ethanol
extraction) and Tab. 3 (part B with cocktail extraction).
Table 2. Numbers of total and positive samples detected in part A using the R5 dipstick
with ethanol extraction (data from all 18 participating laboratories).
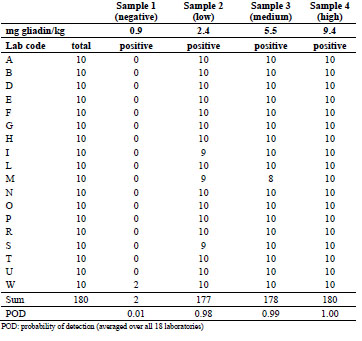
Fourteen out of 18 laboratories reported neither false positives nor false negatives after
ethanol extraction. From the remaining four laboratories, one found two false
positives, three found one false negative for the low concentration, and only one
laboratory reported two false negatives for the medium concentration. Averaged over
all 18 laboratories, this resulted in an extremely low probability of detection (POD) of
0.01 for the negative sample and very high POD values of 0.98, 0.99, and 1.00 for the
low-, medium-, and high-concentrated samples, respectively.
The cocktail extraction procedure yields a fourfold higher dilution compared to the
ethanol extraction. As expected, the sample with the low gliadin concentration showed
higher variability than after ethanol extraction. Despite this difference, the data
provided by 9 out of 18 laboratories revealed no false negatives or false positives.
Table 3. Numbers of total and positive samples detected in part B using the R5 dipstick
with cocktail extraction (data from all 18 participating laboratories).
Only two laboratories found three false positive results in total, which is nearly the
same rate as for the ethanol extraction procedure. For the low-concentrated sample, the
reported detection rate was either 70 to 100% or 0 to 10% for individual laboratories.
This was very interesting, because this implies that the visual inspection resulted in a
clear individual cut-off colour value for a positive sample as opposed to a hypothetical
detection rate of around 50%. As for part A after ethanol extraction, the average POD
for the negative sample after cocktail extraction was very low (0.02). For the low-,
medium-, and high-concentrated samples the POD values were calculated as 0.80,
1.00, and 0.99, respectively. Fig. 1 shows a graphical representation of the raw data for
parts A and B. The POD in 10% increments is plotted against the gliadin
concentration. The larger the circles are, the more laboratories are included, and the
line connects the average POD values (n = 18).
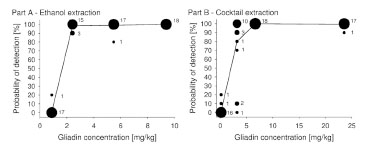
Figure 1. Bubble plots representing the number of labs per probability of detection
(POD) level and gliadin concentration for part A (ethanol extraction) and part B
(cocktail extraction). The numbers next to the circles indicate the number of labs and
the line connects the average POD values (n = 18)
Conclusions
The results of part A (ethanol extraction) and part B (cocktail extraction) of the
collaborative study with 18 laboratories show that the R5 dipstick RIDA® QUICK
Gliadin is capable of qualitatively detecting low levels of gliadin in unprocessed as
well as processed samples. The results substantiate the suitability of the test and can be
used to submit the report to AACC International and AOAC International for
evaluation and addition to the approved methods.
References
1. Catassi C, Fabiani E, Lacono G, et al. A prospective, double-blind, placebocontrolled
trial to establish a safe gluten threshold for patients with celiac disease.
Am J Clin Nutr 2007; 85: 160-166.
2. Wieser H, Koehler P, Konitzer K. Legislation. In: Celiac Disease and Gluten– Multidisciplinary Challenges and Opportunities. Academic Press Elsevier,
London, Waltham, San Diego, 2014; pp. 184-192.
3. Osman AA, Uhlig HH, Valdés I, et al. A monoclonal antibody that recognizes a
potential coeliac-toxic repetitive pentapeptide epitope in gliadins. Eur J
Gastroenterol Hepatol 2001; 13: 1189-1193.
4. Koehler P, Schwalb T, Immer U, et al. AACCI Approved Methods Technical
Committee report: Collaborative study on the immunochemical determination of
intact gluten using an R5 sandwich ELISA. Cereal Foods World 2013; 58: 36-40.
5. Koehler P, Schwalb T, Immer U, et al. AACCI Approved Methods Technical
Committee report: Collaborative study on the immunochemical determination of
partially hydrolyzed gluten using an R5 competitive ELISA. Cereal Foods World
2013; 58: 154-158.
6. Codex Stan 234-1999. Recommended methods of analysis and sampling. Codex
Alimentarius Commission 2001.
7. García E, Llorente M, Hernando A, et al. Development of a general procedure for
complete extraction of gliadins for heat processed and unheated foods. Eur J
Gastroenterol Hepatol 2005; 17: 529-539.
8. Appendix N: ISPAM guidelines for validation of qualitative binary chemistry
methods. AOAC Official Methods of Analysis 2013.
9. Thompson M, Ellison SLR, Wood R. The international harmonized protocol for
the proficiency testing of analytical chemistry laboratories (IUPAC technical
report). Pure Appl Chem 2006; 78: 145-196.
4.3 AOAC Performance Tested Method (SM) 061403 -
Validation of AgraStrip® Gluten G12 assay for the
detection of gluten in food and surfaces
Lukas Frank1, Adrian S. Rogers2, Scott Radcliffe3, Meredith Sutzko3, Zheng Jiang3,
Denise Freitag4, Christy Swoboda4
1 Romer Labs Division Holding GmbH, Tulln, Austria
2 Romer Labs UK Ltd, Runcorn, United Kingdom
3 Romer Labs Inc, Newark, DE, USA
4 Romer Labs Inc, Union, MO, USA
Introduction
Gluten describes the main group of proteins in wheat, rye, and barley and consists of
prolamins (in wheat: gliadin, rye: secalin, barley: hordein) and glutelins (in wheat:
glutenin) occurring in the same ratio. Due to its physicochemical characteristics,
gluten is used in food products as a binder, to help dough rise, and to give dough a
more appetising texture [1]. Coeliac disease is a disorder of the small intestine
resulting in malabsorption and inflammation. In persons who are genetically
susceptible, it is caused by an immune reaction to gliadin, which cannot be
enzymatically degraded to amino acids in the intestine due to its high proline and
glutamine content. The only effective treatment is a lifelong gluten-free diet [1].
According to Codex Alimentarius Standard 118-1979, “gluten-free” products must
comply with gluten levels (including prolamin fractions from rye, barley, and oats)
below 20 mg/kg and “foods specially processed to reduce gluten content” must comply
with levels between 20 and 100 mg/kg [2]. Utilisation of a reliable and accurate
screening method for gluten-free ingredients, foods, and processing equipment will
ensure safety of food products for coeliac sufferers.
Romer Labs® developed an immunochromatographic lateral flow assay for the
qualitative detection of gluten in raw ingredients, processed foods, finished food
products, and environmental surfaces using the G12 antibody developed by Belén
Morón [3]. The G12 antibody targets a 33-mer peptide, which is resistant to enzymatic
digestion and heat denaturation, as well as being the fragment of the gliadin protein, to
which coeliac disease sufferers react, making it a reliable analytical marker. This study
was performed to validate the AgraStrip® Gluten G12 assay method under the
guidance of the AOAC Performance Tested MethodsSM (PTM) program against
AOAC Official Method of Analysis SM 2012.01.
Materials and Methods
Validation study
This validation study was conducted according to the AOAC Approved Final
AgraStrip Gluten G12 Validation Outline v6.2 (February 3, 2014), prepared for Romer
Labs by the AOAC Research Institute PTM program. Parameters tested include: crossreactivity,
interference, incurred samples, food matrixes, environmental surfaces,
product consistency, stability, test kit variation, and robustness [4].
Preparation of validation materials
(a) Gluten-free food matrixes included Bob’s Red Mill White Rice Flour, Ener-G
Foods Gluten-Free Tapioca Loaf, Lucy’s Gluten-Free Sugar Cookies, So Delicious
Coconut Milk Vanilla Bean Ice Cream (package states gluten-free), and Chatfield’s
Double Dark Semi-Sweet Chocolate Chips (package states manufactured in a
dedicated gluten-free facility).
(b) Reference materials used were gliadin produced by the Prolamin Working Group
(PWG), protein content = 91.4%, gliadin content = 88.2%, and wheat gluten produced
by Sigma-Aldrich, Cat. No. G5004, Lot No. SLBD0196V, protein content = 84.0%,
gliadin content as measured by AOAC Official Methods of AnalysisSM (OMA)
2012.01 = 32.6% (Note: during extraction for OMA 2012.01, it was observed that the
wheat gluten tended to agglutinate and adhered to the sides of the extraction vial;
therefore, it is unlikely that all gliadin in the wheat gluten can be accurately measured
in such a concentrated standard by this method).
Spiking of the test samples was performed using purified gliadin (88.2% gliadin by
certificate of analysis) obtained from the PWG, or wheat gluten standard (WGS)
obtained from Sigma-Aldrich (84.0% protein by certificate of analysis). PWG gliadin
was dissolved at 1 mg/mL by weight in 60% ethanol (EtOH), which was calculated to
be a working stock solution at 882 mg/kg gliadin. WGS was suspended at 1 mg/mL by
weight in melted clarified cocoa butter, calculated to be a working stock suspension at
840 mg/kg gluten.
(c) Spiked samples were calculated using dilution factors to achieve the final
concentrations indicated by AOAC Final AgraStrip Gluten G12 Validation Outline for
each spike material and test matrix. Rice flour, bread, and cookies were spiked with
gliadin, which was first dissolved to 1 mg/mL in 60% EtOH. This was further diluted
into an amount of 60% EtOH calculated to saturate 1/10 of the final bulk matrix
sample, then added to the small matrix portion, and EtOH was allowed to evaporate at
room temperature. The small spiked portion was then ground by mortar and pestle to
separate granules and gradually mixed homogeneously by adding 1/10 final bulk
volume unspiked matrix at a time, then remixing, until final bulk volume was
achieved. Ice cream, chocolate, and rice flour for stability, precision, repeatability, and
robustness were spiked with Sigma-Aldrich WGS. Because gluten so readily binds
even small amounts of water, the gluten was suspended at 1 mg/mL in cocoa butter.
Cocoa butter, when melted into a liquid fat, provided a water-free diluent, and it was
possible to incorporate the WGS into the matrix while retaining a coating of fat around
the WGS granules to protect them from binding water in the matrix. Cocoa butter
originates from chocolate, and thus was appropriate for spiking into that matrix.
Because cocoa butter has properties similar to coconut oil, being a solid at room
temperature, it was also deemed appropriate as a spike diluent for ice cream. From the
1 mg/mL WGS stock, a 1/10 dilution was made before spiking a calculated amount
into 1/10 the final bulk volume of melted ice cream or chocolate. Additional melted
ice cream or chocolate was added 1/10 the final bulk volume at a time, then remixed,
until the final bulk volume was achieved. The chocolate was then frozen to -20 °C and
ground. Rice flour was spiked in a similar method, while kept warm to keep the cocoa
butter from setting fully, then the final bulk volume allowed to cool to room
temperature and ground once more. All spike methods were tested prior to performing
the validation study, and homogeneity testing of five samples from each spiked matrix
demonstrated a homogeneously distributed spike. This testing, however, did not take
into account the amount of time required to aliquot the full number of samples needed
for the study, during which the spike in ice cream gradually was exposed to enough
water in the matrix that it began to agglutinate as well as adhere to tube and container
walls, pipet tips, etc. This homogeneity testing, while taken from representative areas
around the bulk sample, could not necessarily detect small “hot spots” of concentrated
spike material within the bulk.
(d) The incurred matrix study, performed by an independent laboratory, involved a
spiking strategy similar to that of Romer Labs, although the entire gluten-free bread
mix matrix was saturated with a more dilute solution of gliadin in 60% EtOH, and
allowed to dry 18 h before baking. Thirty mg/kg gliadin was spiked into the bread mix
prior to baking in order to achieve a final 15 mg/kg gliadin concentration (30 mg/kg
gluten) in the baked bread, per AOAC Final AgraStrip Gluten G12 Validation Outline
V6.2 (Tab. 2 and 5) [4]. The bread mix was prepared and baked following the
manufacturer’s instructions, cooled for 1 h, then dried 18 h using a LabConco freezedry
system and homogenised by mortar and pestle.
(e) For environmental surface testing, a 25 cm2 area of a stainless steel coupon was
spiked with the 1 mg/mL stock solution of gliadin in 60% EtOH by pipetting a volume
onto the surface calculated to spike to the concentrations indicated in AOAC Final
AgraStrip Gluten G12 Validation Outline V6.2. The coupon was then covered and
incubated at room temperature until the EtOH fully evaporated before swabbing.
Methodology
The test procedure was carried out as described in the manufacturer’s package insert.
Analyst 1 spiked sample matrixes in bulk, aliquotted to tubes and extracted, then
blind-coded and randomised extracts. Analyst 2 then ran and read the blinded extracts,
after which results were decoded and analysed. Where indicated in the protocol, a third
analyst tested cross-reactivity and food matrix samples using reference method AOACOMA 2012.01. Note: Previous studies have documented that results of AOAC OMA
2012.01 have a relative standard deviation (RSD) ranging from 22 to 52% depending
on the gliadin concentration of the sample [5].
Results and Discussion
Cross-reactivity study
Thirty-eight gluten-free labelled food samples were screened, unspiked, against the
AgraStrip Gluten G12 assay at the 20 mg/kg threshold for potential cross-reactivity as
well as for quantitative gliadin content using AOAC OMA 2012.01 (LOD = 2.5
mg/kg). The results (not shown) indicate no cross-reactivity with any of the screened
compounds. The authors note that soya flour, at 8.1 mg/kg gliadin, had a higher level
of contamination than desired for this study. Four different brands of soya flour were
tested by AOAC OMA 2012.01, all having similar or higher levels of contamination,
and the brand screened against AgraStrip Gluten G12 represents the brand with the
lowest level of contamination.
Interference study
Each of the 38 samples screened in the cross-reactivity study was spiked with 5 mg/kg
gliadin and assayed with AgraStrip Gluten G12 at the 5 mg/kg and 20 mg/kg threshold
levels. At 5 mg/kg, all spiked compounds returned a positive result, and at 20 mg/kg,
all compounds were negative (data not shown). The authors noted that soya flour,
which with the 8.1 mg/kg contamination level plus the 5 mg/kg gliadin spike was
calculated to have a gliadin concentration of 13.1 mg/kg, had a noticeably brighter test
line at the 5 mg/kg threshold than the other compounds screened, but was still negative
at the 20 mg/kg threshold.
Incurred samples study
The independent laboratory prepared “Bob’s Red Mill Homemade Wonderful” glutenfree
bread mix in unspiked and 30 mg/kg (target 15 mg/kg after baking) gliadin spike
portions. The bread mix ingredients are as follows: stone-ground garbanzo bean flour,
potato starch, corn starch, sweet white sorghum flour, tapioca flour, evaporated cane
juice, fava bean flour, xanthan gum, active dry yeast, potato flour, sea salt (magnesium
carbonate as flowing agent), guar gum, and soy lecithin. The yeast package was
bloomed in warm milk for 5 min, then added to bread mix, along with one egg, ¼ cup
melted butter, and one teaspoon cider vinegar. The ingredients were mixed, placed into
a baking pan, then covered and allowed to rise for 30 min. The bread was next baked
in a Hot Point model R3787W oven at 375 °F (approximately 190 °C) for 50 min and
then allowed to cool on the bench for 1 h. The cooled bread was freeze-dried,
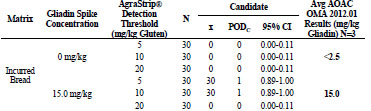
homogenised, and tested with AgraStrip Gluten G12. Tab. 1 shows that unspiked
samples all returned a negative result. For the spiked samples, at 30 mg/kg gluten, the5 and 10 mg/kg thresholds returned all positive results, while the 20 mg/kg threshold
returned all negative results.
Table 1. Independent laboratory incurred sample study results.
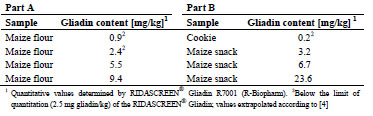
Food matrix testing
The following food matrixes were pre-screened by AOAC OMA 2012.01 for gliadin
content: white rice = 0.0 mg/kg, gluten-free cookies = 0.18 mg/kg, gluten-free bread =
0.08 mg/kg, gluten-free ice cream = 0.15 mg/kg, and gluten-free chocolate = 0.05
mg/kg. For each of the 5, 10, and 20 mg/kg threshold levels, the aforementioned food
matrixes (n = 30) were spiked with 0, 3, 8, 15, and 25 mg/kg gliadin (rice flour,
cookies, bread) or WGS (ice cream, dark chocolate), then assayed with AgraStrip
Gluten G12. As well, three replicates of each spike level were screened for gliadin
content using AOAC OMA 2012.01. The independent laboratory also performed a
food matrix test using rice flour.
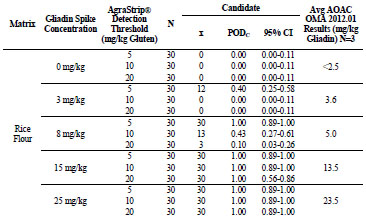
For rice flour tested by the independent laboratory, shown in Tab. 2, the 0, 3, 8, 15,
and 25 mg/kg gliadin spikes returned gliadin concentrations at <2.5, 2.9, 7.5, 15.2, and
23.0 mg/kg, respectively. At 0 and 3 mg/kg gliadin spikes, AgraStrip Gluten G12 had
POD of 0.00 at all three gluten thresholds. At 8 mg/kg gliadin spike, the POD was
1.00, 0.10, and 0.00 at the 5, 10, and 20 mg/kg gluten thresholds, respectively.
At 15 mg/kg gliadin spike, the PODs were 1.00, 1.00, and 0.10 at the 5, 10,and 20
mg/kg gluten thresholds, respectively. At 25 mg/kg gliadin spike, POD was 1.00 at all
three thresholds.
For rice flour, shown in Tab. 3, the 0, 3, 8, 15, and 25 mg/kg gliadin spikes returned
gliadin concentrations at <2.5, 3.6, 5.0, 13.5, and 23.5 mg/kg, respectively. At 0 mg/kg
gliadin (0 mg/kg gluten) spike, AgraStrip Gluten G12 had a POD of 0.00 at all three
gluten thresholds. At 3 mg/kg gliadin (6 mg/kg gluten), PODs were 0.40, 0.00, and
0.00 at the 5, 10, and 20 mg/kg thresholds, respectively. At 8 mg/kg gliadin (16 mg/kg
gluten) spike, there were PODs of 1.00, 0.43, and 0.10 at the 5, 10, and 20 mg/kg
gluten thresholds, respectively. At 15 and 25 mg/kg gliadin (30 and 50 mg/kg gluten)
spikes, POD was 1.00 at all three thresholds.
Table 2. Independent laboratory food matrix testing results for rice flour.
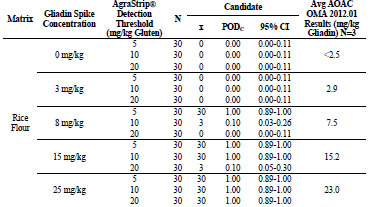
Table 3. Food matrix testing results for gliadin-spiked rice flour.
For gluten-free cookies, shown in Tab. 4, the 0, 3, 8, 15, and 25 mg/kg gliadin spikes
returned gliadin concentrations at 0.3, 2.7, 8.3, 11.7, and 17.8 mg/kg, respectively. At
0 mg/kg gliadin (0 mg/kg gluten) spike, AgraStrip Gluten G12 had a POD of 0.00 at
all three gluten thresholds. At 3 mg/kg gliadin (6 mg/kg gluten), the PODs were 0.93, 0.87, and 0.00 at the 5, 10, and 20 mg/kg thresholds, respectively. At 8 mg/kg gliadin
(16 mg/kg gluten) spike, there were PODs of 1.00, 1.00, and 0.13 at the 5, 10, and 20
mg/kg gluten thresholds, respectively. At 15 mg/kg gliadin (30 mg/kg gluten) spike,
there were PODs of 1.00, 1.00, and 0.97 at the 5, 10, and 20 mg/kg thresholds,
respectively. At 25 mg/kg gliadin (50 mg/kg gluten) spike, the POD was 1.00 at all
three thresholds.
Table 4. Food matrix testing for gliadin-spiked gluten-free cookies

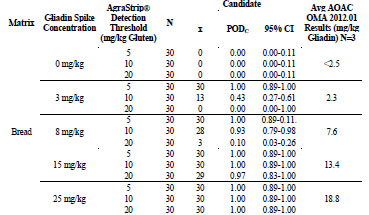
For gluten-free bread, shown in Tab. 5, the 0, 3, 8, 15, and 25 mg/kg gliadin spikes
returned gliadin concentrations at <2.5, 2.3, 7.6, 13.4, and 18.8 mg/kg, respectively. At
0 mg/kg gliadin (0 mg/kg gluten) spike, AgraStrip Gluten G12 had a POD of 0.00 at
all three gluten thresholds. At 3 mg/kg gliadin (6 mg/kg gluten), the PODs were 1.00,
0.43, and 0.00 at the 5, 10, and 20 mg/kg thresholds, respectively. At 8 mg/kg gliadin
(16 mg/kg gluten) spike, there were PODs of 1.00, 0.93, and 0.10 at the 5, 10, and 20
mg/kg gluten thresholds, respectively. At the 15 mg/kg gliadin (30 mg/kg gluten)
spike, there were PODs of 1.00, 1.00, and 0.97 at the 5, 10, and 20 mg/kg thresholds,
respectively. At the 25 mg/kg gliadin (50 mg/kg gluten) spike, the POD was 1.00 at all
three thresholds.
Table 5. Food matrix testing for gluten-free bread.
For gluten-free ice cream the 0, 3, 8, 15, and 25 mg/kg WGS spikes returned gliadin
concentrations at <2.5, 6.2, 21.4, 38.2, and 30.4 mg/kg, respectively. At 0 mg/kg WGS
spike, AgraStrip Gluten G12 had a POD of 0.00 at all three gluten thresholds. At 3
mg/kg WGS, the PODs were 1.00, 0.93, and 0.00 at the 5, 10, and 20 mg/kg
thresholds, respectively. At 8 mg/kg WGS spike, there were PODs of 1.00, 1.00, and
0.33 at the 5, 10, and 20 mg/kg gluten thresholds, respectively. At 15 and 25 mg/kg
WGS spike, the POD was 1.00 at all three thresholds.
For gluten-free chocolate the 0, 3, 8, 15, and 25 mg/kg WGS spikes returned gliadin
concentrations at <2.5, 4.4, 5.6, 13.2, and 32.9 mg/kg, respectively. At 0 mg/kg WGS
spike, AgraStrip Gluten G12 had a POD of 0.00 at all three gluten thresholds. At 3
mg/kg WGS, the PODs were 0.10, 0.00, and 0.00 at the 5, 10, and 20 mg/kg
thresholds, respectively. At 8 mg/kg WGS spike, there were PODs of 0.93, 0.23, and
0.03 at the 5, 10, and 20 mg/kg gluten thresholds, respectively. At 15 mg/kg WGS
spike, there were PODs of 1.00, 1.00, and 0.57 at the 5, 10, and 20 mg/kg thresholds,
respectively. At 25 mg/kg WGS spike, the POD was 1.00 at all three thresholds.
Rice flour spiked with WGS at 10 000 mg/kg was also tested to determine whether the
assay could experience hook effect at high contamination levels. Results indicate
positive results at all three thresholds.
Environmental surface testing
Both the independent laboratory and the authors prepared 25 cm2 stainless steel
coupons as unspiked with n = 5, fractional recovery spike of 3.5 μg gliadin (7 μg
gluten) with n = 30, and high level spike at 17.7 μg gliadin (35.4 μg gluten) with n = 5.
Both laboratories recorded AgraStrip Gluten G12 results as all negative for the
unspiked coupons, and all positive for the high level (data not shown). For fractional
recovery, the independent laboratory recorded 19/30 positive, and the authors recorded
18/30 positive.
Further testing
Intra- and inter-assay variation, stability, and robustness studies were carried out as
well but did not show any significant conspicuities, thus justifying the positive AOAC –RI approval (data not shown).
Conclusions
The results of this study demonstrate that the AgraStrip Gluten G12 test kit will neither
cross-react with a broad spectrum of gluten-free food samples, nor will those samples
interfere with a positive result. Environmental surface spikes were recovered as
expected, demonstrating no false-positive results, fractional recovery just below the
LOD, and recovery at high spike concentration. The assay demonstrated consistent
results between different production lots, as well as between different kits within the
same lot. Ongoing stability studies show that the AgraStrip Gluten G12 kit is stable
over a period of three months, as well as over a period of 50 days during accelerated
stability at 42 °C. Results of the robustness study indicated that shortening the protein
extraction time is not advisable, nor is halving the amount of extraction buffer used, as
this effectively doubles the gluten concentration in the extract. A 5 min extraction,
over-filling the extraction buffer, and varying the AgraStrip incubation time did not
significantly affect the test outcome. Food matrix testing indicates the AgraStrip
Gluten G12 assay is capable of detecting the presence of 5, 10, and 20 mg/kg gliadin
spike levels in gluten-free rice flour, cookies, and bread at the respective 5, 10, and 20
mg/kg assay thresholds. Per the validation outline, gliadin was spiked at 0, 3, 8, 15,
and 25 mg/kg levels, though it comprises only approximately 50% of the total protein
content of gluten. The AgraStrip Gluten G12 antibodies detect the presence of gluten
through a gliadin epitope; however, the assay is designed to reflect gluten content
(while AOAC OMA 2012.01 measures gliadin content). Therefore, food matrix
testing, where gliadin was spiked at 3, 8, 15, and 25 mg/kg, represents gluten concentrations
of approximately 6, 16, 30, and 50 mg/kg in the AgraStrip Gluten G12 assay.
During incurred matrix testing, no spike recovery at the 20 mg/kg threshold was observed,
despite the sample having measured at approximately 15 mg/kg gliadin or 30
mg/kg gluten. Because AOAC OMA 2012.01 has a RSD ranging from 22 to 52% the
range for the amount of gliadin in the baked bread allows for the possibility that the
amount of gliadin in the baked bread could have been below the 20 mg/kg threshold.
The AgraStrip Gluten G12 assay has been observed to perform reliably when testing
heat-treated samples, due to the highly stable sequential epitope, which the G12
antibody detects. The high gliadin concentrations observed during the gluten-free ice
cream testing reflect the difficulty of spiking complete WGS into a food matrix containing water. The gluten particles drew water in, bloomed, and tended to adhere to
tube walls and pipet tips, as well as agglutinate. This agglutinative effect caused by the
water present in ice cream likely produced heterogeneity of gluten concentrations
observed with that matrix. A gliadin spike into the ice cream likely would have
produced better homogeneity. Because a fat, cocoa butter, was used to suspend and
dilute the WGS for chocolate, and chocolate had far less water content, better
homogeneity was achieved, and the results more accurately reflect detection of the
spike levels of WGS, despite the high levels of tannins present in 70% cocao dark
chocolate tested. Still, at the 8 mg/kg threshold in chocolate, two false-negative results
were observed. These results were due to the chocolate hardening in the bottom of the
extraction tube, before it could be fully mixed with the extraction buffer. These results
do not indicate a failure of the assay to detect gluten, but rather reflect the challenge of
spiking and manipulating, within such a large study, a matrix having physical
properties of chocolate. Over the entire study, no false-positive results were observed
in any blank sample. The AgraStrip Gluten G12 test kit is a consistent, stable, robust,
and accurate lateral flow assay for the qualitative detection of gluten in raw
ingredients, processed food, finished food products, and environmental surfaces.
Abbreviations
N Number of test portions
x Number of positive test portions
PODC Candidate method confirmed positive outcomes divided by the total
number of trials
95% CI Confidence Intervals
References
1. Leonard MM, Vasagar B. US perspective on gluten-related diseases. Clin Exp
Gastroenterol 2014; 7: 25-37.
2. Codex Standard for Foods for Special Dietary Use for Persons Intolerant to Gluten
(1979) Codex Alimentarius, Codex Standard 118–1979, rev. 2008, pp. 1-3.
http://www.codexalimentarius.org/download/standards/291/cxs_118e.pdf.
3. Morón B, Cebolla Á, Manyani H, et al. Sensitive detection of cereal fractions that
are toxic to celiac disease patients by using monoclonal antibodies to a main
immunogenic wheat peptide. Am J Clin Nutr 2008; 87: 405-414.
4. Koerner TB, Abbott M, Godefroy SB, et al. Validation Procedures for
Quantitative Gluten ELISA Methods: AOAC Allergen Community Guidance and
Best Practices. J AOAC Int 2013; 96: 1033-1040.
5. Popping B, Diaz-Amigo C, Hoenicke K. Molecular Biological and Immunological
Techniques and Applications for Food Chemists, Wiley, Hoboken, NJ, 2010 p.
368.
4.4 Proposal for developing a hordein standard for
barley-based products
Päivi Kanerva, Xin Huang, Hannu Salovaara, Tuula Sontag-Strohm
University of Helsinki, Helsinki, Finland
Introduction
Immunological ELISA assays are used for the quantification of residual gluten in
gluten-free products. These assays are based on the assumption that the protein
fractions that are harmful for people with coeliac disease are similar in wheat, barley,
and rye. However, this is not true. Each cereal has its own composition of proteins.
Protein content of wheat and barley is about the same being around 12 - 14%, whereas
the protein content in rye is somewhat lower, being about 10%. The protein fraction,
which is harmful for coeliacs, accounts for about 60 - 80% of the total protein content
of wheat, barley, and rye. This protein fraction is called gluten. Gluten contains
multiple proteins that are named gliadins and glutenins in wheat, hordeins in barley,
and secalins in rye.
The quantification of gluten is typically based on a gliadin reference material, which is
not suitable for the quantification of barley hordeins [1]. Despite similarities, gliadins
are not directly comparable to hordeins and secalins, and several differences are
known. Therefore, we consider it necessary to develop a separate reference material
for the quantification of barley prolamins from gluten-free products with possible
barley contaminations, such as oat products.
Prolamins of wheat, barley, and rye
Codex Standard 118 for “foods for special dietary use for persons intolerant to gluten” describes gluten as the protein fraction, to which some persons are intolerant and that
is insoluble in water and 0.5 mol/L NaCl [2]. Half of the gluten proteins are considered
to be prolamins, which are defined as the fraction from gluten that can be extracted by
40 - 70% of ethanol. Gluten contains multiple proteins, which are grouped by their size
and composition. All of them are soluble in aqueous alcohol solution and contain high
amounts of the amino acids proline and glutamine. Some of these proteins, however,
need reduction to render them soluble in aqueous alcohol, because they form highmolecular-
weight (HMW) polymers stabilised by disulphide bonds. Examples for
these are glutenins in wheat and D-hordeins in barley. These proteins are often
considered as glutelins, but due to the homology of the proteins extracted in aqueous
alcohols with or without reduction, it would be better to call all of them prolamins as
suggested by Shewry and Tatham [3]. In wheat, low-molecular-weight (LMW)
glutenin subunits are actually very similar to gliadins based on their amino and
sequence and molecular weight. The main difference between gliadins and LMW glutenins is the lower solubility of LMW glutenin subunits in aqueous alcohols
without reduction. There are, however, differences in the amino acid compositions of
HMW glutenins of wheat when compared to gliadins.
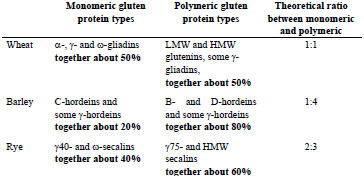
Gluten proteins are often divided into monomers and polymers based on differences in
their tendency to form aggregates. Wheat α-, γ- and ω-gliadins are regarded as
monomers, while HMW and LMW glutenins form polymers. In barley, only C- and γ-
hordeins exist as monomers, while B- and D-hordeins form polymers. In rye, the
protein types are γ40k- and ω-secalins, and γ75k- and HMW-secalins, respectively.
The relative ratios of these monomeric and polymeric proteins have been calculated
and are shown in Tab. 1.
In the Codex Standard for gluten-free products, the prolamins are considered to be the
monomeric fraction, whereas the polymeric fraction (glutenins) is not solubilised or
not recognised by the antibody. Therefore, prolamin contents are multiplied by two to
get the gluten content of the sample. If we look at the ratios between theoretical
amounts of monomeric and polymeric proteins in different cereals, we get different
numbers for each cereal.
Table 1. Theoretical ratios of monomeric and polymeric gluten protein types.
However, in practice, considerable amounts of polymeric proteins are extracted by
aqueous alcohol without reduction (Fig. 1). This can be seen especially with barley
and rye. In barley, based on the solubility, C- and part of the B-hordeins would belong
to prolamin group, while the remaining B-hordeins and D-hordeins would be glutelins.
It depends on the extraction conditions, which proportion of B-hordeins is extracted
into alcohol solution without reduction and how many of them need reduction of
disulphide bonds before being solubilised. In rye, all secalin groups (γ-40k-, γ-75k-, ω-
and HMW-secalins) are soluble to a certain extent in aqueous alcohols, while γ-75- and HMW-secalins, which have a higher molecular weight, need reducing conditions
to become alcohol-soluble.
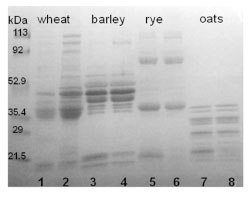
Figure 1. SDS-PAGE separation of gluten proteins of wheat, barley, rye, and oats
under reducing conditions. Samples were extracted with 60% ethanol (odd numbers)
or with 60% ethanol and 1% DTT (even numbers)
Therefore, dividing gluten proteins into two fractions, prolamins and glutelins, is not
practical. Since proteins in these groups share high similarity with each other, the
proportion of proteins falling into each group varies and creates unnecessary error,
when the total gluten content is calculated. Instead, these proteins could be considered
as one group, in which all proteins can be considered harmful for coeliacs. Reference
materials and assays for gluten quantification should aim to detect all gluten protein
types.
Separate reference materials to each harmful cereal
High complexity of gluten proteins makes it very difficult to develop antibodies that
could recognise all protein types. Antibodies bind to different prolamin types with
different affinities, which evidently causes inaccuracies in analyses. One way to
minimise these inaccuracies would be the development of separate reference materials
for products containing gluten from different cereals. There is already a separate
reference material for products containing hydrolysed proteins [4].
We suggest that separate gluten reference materials should be produced for each
cereal. These reference materials should contain all gluten proteins types of that cereal
so that the material would represent the gluten composition of flour as close as
possible. It would be important to study the recognition of antibodies towards all
gluten protein types, so that the gluten content is measured directly and no
multiplication factors are needed. The different reactivity of antibodies with gluten protein types and the variability between cultivars with respect to the gluten
composition have an effect on the results. Therefore, it is important to investigate this
variance and determine how strongly the results are affected.
When using separate reference materials for gluten detection for each coeliac-active
cereal, we will face a problem with products with an unknown source of
contamination. Contamination can come from one or more sources and choosing the
right reference material is challenging. Another method is needed to find out the
source of contamination and the reference material should be decided on this basis. If
several sources are present, the reference material with the lowest reactivity would
offer the safest way to avoid false-negative results.
Conclusion
We are suggesting a specific reference material for barley-based products and products
with a possible barley contamination. The reference material should contain all gluten
protein types so that they would resemble the total gluten content in flour. The
reference material should be produced from carefully selected barley cultivars that
would represent the entire of range compositions.
References
1. Kanerva P, Sontag-Strohm T, Ryöppy P, et al. Analysis of barley contamination in
oats using R5 and ω-gliadin antibodies. J Cereal Sci 2006; 44: 347-352.
2. Codex Standard 118-1979. Codex standard for foods for special dietary use for
persons intolerant to gluten. Codex Alimentarius.
3. Shewry PR, Tatham AS. The prolamin storage proteins of cereal seeds: structure
and evolution. A review. Biochem J 1990; 267: 1-12.
4. Gessendorfer B, Koehler P, Wieser H. Preparation and characterization of
enzymatically hydrolyzed prolamins from wheat, rye, and barley as references for
the immunochemical quantitation of partially hydrolyzed gluten. Anal Bioanal
Chem 2009; 395: 1721-1728.
4.5 Development of wheat varieties with reduced
contents of coeliac-immunogenic epitopes through
conventional and GM strategies
Marinus J.M. (René) Smulders1, Aurélie Jouanin1,2, Jan Schaart1, Richard G.F.
Visser1, James Cockram2, Fiona Leigh2, Emma Wallington2, Lesley A. Boyd2, Hetty
C. van den Broeck3, Ingrid M. van der Meer3, Luud J.W.J. Gilissen3
1 Wageningen UR, Plant Breeding, Wageningen, The Netherlands
2 NIAB, Cambridge, UK
3 Wageningen UR, Bioscience, Wageningen, The Netherlands
Abstract
Cereals, especially wheat, may cause several food-related diseases, of which gluten
intolerance (coeliac disease, CD) is the best defined: specific immunogenic epitopes,
nine amino acid-long peptide sequences, have been identified from various gluten
proteins. These may activate T cells, causing inflammation of the small intestine and a
wide variety of other symptoms. Here, we review several breeding-related strategies
aiming at reduction or elimination of such epitopes from wheat, including variety
selection, re-synthesis of hexaploids, deletion of specific chromosomal fragments,
RNA-interference, mutagenesis and genome editing using CRISPR/Cas9. The related
issue of genetic modification (GM) is discussed. These strategies should lead to wheat
food products to be used in gluten-free diets for diagnosed CD individuals and/or to
strongly reduce the burden from immunogenic gluten to the non-diagnosed CD
population.
Introduction
Cereals may cause allergies and intolerances after consumption in some people. The
prevalence of IgE-mediated allergy to wheat (and cereals in general) is very low,
although wheat contains many immunogenic proteins, however, without clinical
relevance [1,2]. Individuals that express the human leukocyte antigen (HLA-) DQ2
and/or DQ8 can become intolerant to gluten proteins from wheat, rye, and barley and
may develop coeliac disease (CD), a chronic inflammation of the small intestine. This
leads to a variety of symptoms ranging from bowel to skin, bone, nerve, and muscle
complaints. The prevalence of CD is 1 - 3% of the general population worldwide.
Strict gluten-free consumption is currently the only remedy.
Recently, a new condition, separate from CD called ‘gluten sensitivity’ or ‘wheat
sensitivity’ has arisen, even though no medical connection to gluten consumption or
particular wheat-specific compounds has been made. Based on the frequency of people
with clinical bowel complaints (irritable bowel syndrome, IBS) that seem to improve
on a gluten-free diet, the prevalence of this non-celiac wheat sensitivity (NCWS) might be 6% of the population [2]. As well as individuals diagnosed with CD or IBS,
others have actively decided to avoid wheat and gluten, however, often for (selfdiagnosed)
reasons without clear medical motives, but rather for personal (healthrelated)
preference.
Avoiding consumption of gluten from wheat, rye, and barley is in practice difficult to
do. Several strategies have, therefore, been considered to reduce the incidence of
cereal-related diseases, with major focus on CD [2]. Strategies include the reduction of
the number of CD epitopes in gliadins and glutenins in wheat, or the reduction of the
levels of these proteins in wheat grains. Two groups of people that may especially
benefit from such gluten-free or reduced-gluten food products are individuals not yet
diagnosed with CD (which is the majority of CD sufferers), and the potential patients
who may develop CD or IBS after prolonged and abundant wheat and gluten
consumption. Here, we review several of these strategies, based on variety selection,
re-synthesis of hexaploids, deletion of specific chromosomal fragments, RNA
interference, mutagenesis, and genome editing.
In search of low CD-toxic wheat accessions and varieties
Gene-bank wheat collections around the world contain modern and old varieties of
hexaploid and tetraploid wheat varieties, as well as landraces (locally adapted/grown
wheat populations that pre-date modern breeding approaches), wild emmers (Triticum
dicoccoides) and wild diploid species that are related to the ancestors of cultivated
tetraploid and hexaploid wheat. Gene-banks are a useful source of wheat germplasm
for analysing the relationships between individual gluten genes, proteins, or epitope
variants and CD immunogenicity, and may contain wheat lines that can be identified
as less harmful.
It is not straightforward to make wheat CD-safe, i.e., to develop wheat varieties with
fewer or no immunogenic gliadin and glutenin epitopes. Commercial wheat varieties
are tetraploid or hexaploid, and gliadins, which carry the most immunogenic epitopes,
are encoded by large gene families. However, the epitopes are now reasonably well
characterised. In 2012, a list of well-defined CD epitopes was published [3] (twentyfour
HLA-DQ2 restricted epitopes and seven HLA-DQ8 restricted epitopes), including
six epitopes from α-gliadins and 11 from γ-gliadins, complemented by two ω-gliadin
epitopes, three low-molecular-weight (LMW)-glutenin, and two high-molecularweight
(HMW)-glutenin epitopes (only DQ8-restricted). As over 90% of CD patients
are HLA-DQ2 positive, the HLA-DQ8 epitopes play a minor role in the development
of CD [4]. All epitopes are nine amino acids long, forming the peptide fragment that
fits into the DQ2 and DQ8 receptor-grooves, from where the epitopes are presented to
the T cells.
At the genomic level, the occurrence of CD epitopes varies between gliadin genes
(each locus comprising of multiple gene copies), between homoeologous loci, and
between wheat varieties and species. The α-gliadin gene sequences from the D genome
contribute most to CD immunogenicity, while those from the B genome contribute the
least [5-8]. For γ-gliadins, the highest number of CD epitopes has also been found in the genes residing on the D genome [9]. Less sequence information is available for ω-
gliadins. The involvement of ω-gliadins in CD immunogenicity has been recognized
recently from cross-reactivity of T cells with rye and barley epitopes [10].
Screening with monoclonal antibodies (mAbs) revealed limited gliadin genetic
diversity in modern wheat varieties [11]. This study also demonstrated an increased
presence of Glia-α1 epitopes and a reduced presence of Glia-α3 epitopes in modern
wheat varieties compared to landraces and older varieties. CD patients respond more
violently to Glia-α1 epitopes than to Glia-α3 [12, 13]. The increase in Glia-α1 may be
the result of wheat breeding during the last decades [14]. Some old hexaploid wheat
varieties have been identified with relatively low mAb response, as have two lines
derived from a heterogeneous tetraploid durum wheat landrace [15]. In addition,
analysis of nine landraces of farro wheat (T. turgidum ssp. dicoccum) revealed three
landraces causing negligible proliferation of T cell lines from CD patients (comparable
to the negative control), whereas the other landraces studied showed intermediate to
very high responses [16].
Diploid einkorn wheat (T. monococcum, A genome) is an ancient wheat species with
good nutritional characteristics and bread making quality. Food products made from
the variety ‘Monlis’ have been shown to be tolerated by CD patients, revealing similar
absence of CD toxicity-related symptoms as found for rice [17]. New combinations of
gluten genes can be made by crossing and selection at the diploid level, although this
is a tedious procedure. The increasing incidence of CD during recent decades would
justify that reduced levels of CD epitopes become a new quality trait in wheat breeding
[14].
The utility of screening wheat seed material using epitope-specific mAbs is, however,
limited. The specificity of mAbs varies, and is not exactly the same as that of the
major histocompatibility complex (MHC) as the mAbs only recognise peptide
sequences of four to six amino acids, which is substantially shorter than the nine
amino acid-long epitope sequences. Therefore, the identification of wheat genotypes
with reduced CD toxicity using mAbs should be regarded as a preliminary screen, with
selected lines being rescreened with more accurate methods. In this regard, we have
previously examined the CD immunogenic potential of tetraploid durum wheat by
deep sequencing of the N-terminal region of α-gliadin transcripts, which includes the
repetitive domain with potential CD epitopes, from grains at two developmental stages
[18]. A direct approach would be to use quantitative proteomics to identify the gliadins
in mature grains, as it determines the exact amino acid sequence and the amount of the
proteins produced during grain development. This is difficult, because of the diversity
of gluten genes in any single wheat variety, and the relative insensitivity of these
proteins to the proteolysis step necessary for analysis. However, methods have now
been developed that enable identification and quantification of specific CD epitopes in
chymotryptic gluten digests [35].
Reconstituting hexaploid bread wheat: synthetic hexaploids
The α-gliadins encoded on the D genome of bread wheat possess the highest CDimmunogenic
potential [6,7], and different varieties are quite similar in this respect.
Overall, the genetic variation in the D genome of bread wheat is much lower than that
present in the A and B genomes. This suggests that the hybridisation of T. turgidum
(AB genome) with Aegilops tauschii (D genome) to form T. aestivum (ABD genome),
hexaploid bread wheat, involved only a few Ae. tauschii genotypes, resulting in a
strong genetic bottleneck. This has been supported by several studies that show high
levels of genetic diversity among wild Ae. tauschii accessions [19, 20]. In order to
introduce new quality characteristics into bread wheat, T. turgidum spp. durum has
been hybridised with genetically diverse Ae. tauschii accessions, followed by
chromosome doubling, to produce new, synthetic hexaploid wheat (SHW), amongst
others at CIMMYT (Mexico) and at NIAB (UK). We are now screening Ae. tauschii
accessions that are low in immunogenic gliadins to produce customised SHW that may
result in wheat-based products that are safer for CD patients (Schaart et al., in prep).
Deleting entire loci
Wheat deletion lines lack part of chromosomes. A set of hexaploid wheat deletion
lines of the variety ‘Chinese Spring’ (http://www.k-state.edu/wgrc/
Germplasm/Deletions/del_index.html) was used to test the effects of individual
deletions on the reduction of CD epitopes and on changes in baking-technological
properties. A line, in which the short arm of chromosome 6D (6DS) is missing, was
analysed. This deletion had eliminated the 6D α-gliadin locus and resulted in strongly
decreased mAb responses against Glia-α1 and Glia-α3 epitopes, along with a clearly
visible loss of particular protein bands in one-dimensional gel electrophoresis [21]. It
also led to a significant change in dough mixing properties and dough rheology, with
the dough becoming stiffer and less elastic. Dough quality could be improved or
restored with oat prolamins (avenins) [14]. In contrast, the deletion of D genome ω-
gliadins, γ-gliadins, and low molecular weight (LMW)-glutenin subunits on
chromosome 1DS removed some epitopes, but retained technological properties [21].
As large chromosome deletion lines often grow poorly due to the loss of many genes,
deletion lines are useful as model systems, but are not applicable in commercial
breeding programs.
RNAi
Since glutenins are most important for baking quality and gliadins contain most of the
CD epitopes, scientists have been exploring ways to mutate, delete or silence just the
gliadin genes. Two research groups have successfully silenced gliadin expression
using RNA interference (RNAi). Becker et al. [22] silenced α-gliadins, eliminating 20
different storage proteins from the grains. Gil-Humanes et al. [23] also effectively
down-regulated various gliadins in bread wheat. Using T-cell tests, they found a 10 to
100-fold reduction of DQ2 and DQ8 epitopes in α-gliadins, γ-gliadins, and ω-gliadins.
Indeed, total gluten extracts of three transgenic wheat lines failed to elicit T cell responses [23]. Baking-technologically relevant parameters were also tested, with
down-regulation of γ-gliadins resulting in an increase of other gluten proteins, but with
little or no effect on dough strength, or gluten and starch properties [24-26].
A different approach used RNAi to suppress the DEMETER (DME) homoeologues in
wheat [27]. The DME genes encode a 5-methylcytosine DNA glycosidase, which
demethylates the promotor regions of gliadins and LMW glutenins in the wheat
endosperm. This demethylation is essential for activation of the genes during
endosperm development. Transformed plants showed a high degree of suppression in
DME gene transcript abundance, with >75% reduction in the amount of immunogenic
prolamins.
Such RNAi wheat lines, as long as their agronomic properties and yields are
acceptable, may become candidates for the production of wheat-based products for ‘gluten-free’ or ‘low-in-gluten’ diets. However, it should be noted that a line with an
RNAi construct stably integrated into the genome is considered a GM plant. The costs
of the regulatory process of GM plants worldwide prevents these lines from being
developed into commercial varieties. Additionally, growth of GM crops is banned in
many countries, providing a further disincentive to commercially produce GM wheat
varieties for CD patients.
Mutation breeding
Mutation breeding is based on the induction of random mutations followed by
selection of plants carrying mutations in the target gene(s). The mutation-selection
process is called Targeting Induced Local Lesions in Genomes (TILLING). It can be
performed on populations, in which mutations have been induced chemically, for
example by ethyl methane sulfonate (EMS) treatment of seed, by gamma-radiation or
by fast neutrons. Products from mutation breeding are exempted from GM regulation
in the EU. The question of whether the number, or nature of the mutations is sufficient
to have a significant effect on the number of CD epitopes expressed has never been
studied in detail. Mutation breeding in a polyploid plant is challenging, as a mutation
of a single locus usually does not produce a phenotype. Fewer CD epitopes in the
multigene gliadin families would also not produce a different phenotype, so we intend
to screen the relevant part of the gliadin genes using next generation sequencing
(NGS) approaches [18].
EMS mutation primarily results in G/C to A/T nucleotide transitions. Applying EMS
to bread wheat may, therefore, create point mutations in α-gliadin or γ-gliadin genes,
some of which would disrupt CD epitopes or result in truncation of the predicted
proteins (stop-codon mutation). At UC Davis (USA), a tetraploid wheat EMS
population exists for T. turgidum cv. ‘Kronos’ [28]. Recently, the ‘Kronos’ TILLING
population has been sequenced following exome capture [29], allowing mutants to be
identified bioinformatically. We intend to screen the exome capture sequence data to
identify and prioritise mutations in gliadin genes. The next step will be to confirm the
gliadin expression profiles in developing grains of selected mutants or offspring thereof, at mRNA [18] and/or protein level, followed by combining selected mutant
homoeologues into a common genetic background by crossing, and removal of
background mutation by back-crossing to the Kronos parent.
Gamma irradiation produces reactive oxygen species (ROS) that cause DNA oxidative
damage or DNA single/double strand breaks. When double strand breaks are repaired
by Non-Homologous End Joining (NHEJ), which is an error-prone process, this may
cause base-pair substitutions, large deletions [30] or even inversions [31]. These can
mutate (inactivate) epitopes, remove whole gliadin genes or even multiple genes. We
plan to screen an existing population of gamma-irradiated hexaploid wheat of the
cultivar ‘Paragon’ (made at the John Innes Centre, Norwich, UK) for (i) the loss of
genes using a quantitative DNA method and (ii) the occurrence of smaller mutations
and the expression of the related genes.
Genome editing
CRISPR/Cas9 is technically a relatively easy technique to perform genome editing,
i.e., the induction of mutations and deletions at specific, targeted locations within the
genome [32]. This requires the introduction of a construct that contains the code for a
nuclease, Cas9 and a guide RNA that targets the gene sequence to be altered. The
nuclease will generate double strand breaks, which will be repaired by NHEJ in some
plants introducing indels and other errors [33]. In wheat, this technology can mutate
genes on the three homoeologous chromosomes simultaneously [34]. Since gliadins
are grouped at single loci on chromosome groups 1 and 6, double strand breaks
simultaneously generated in genes located close to each other within the same locus
could lead to deletion of the intervening gene copies. We want to explore this method,
and determine whether this system can mutate or remove gliadin genes/epitopes and
thus, can contribute to lowering the level of CD epitopes in wheat. Since
CRISPR/Cas9 constructs would be transformed into wheat, the approach used here is
considered GM under the current European legal framework. However, as the GM
CRISPR/Cas9 construct can be removed by segregation in subsequent generations, the
offspring may be considered non-GM in other parts of the world, where the product of
GM is considered rather than the process used to generate it.
Alternative targeted mutagenesis towards synthetic hexaploids
The strategies described above may also be combined. For instance, TILLING and
CRISPR/Cas9 could be implemented in diploid Ae. tauschii to remove CD epitopes
and/or α-gliadins. Selected offspring, with fewer α-gliadin gene copies or fewer
immunogenic epitopes, could then be hybridised with the tetraploid hypoimmunogenic
landraces [15, 16] to create a synthetic hexaploid safer for CD patients.
Conclusions
‘Reduced CD toxicity’ (through a combination of selection of germplasm, mutation
breeding, and/or genetic modification) is predicted to become a global breeders’ aim in
Acknowledgements
The research was partially funded by the Celiac Disease Consortium, the EFRO
project ‘Nieuwe detectiemethoden voor coeliakie en coeliakie-inducerende gluten in
voeding’ (2011-018974) and FP7-PEOPLE-2013-ITN, EID Maximising the potential
of CROP researchers (Max-CROP), grant no. 607178. It does not necessarily reflect
the views of the European Commission and in no way anticipates the Commission’s
future policy in this area.
References
1. Zuidmeer L, Goldhahn K, Rona RJ, et al. The prevalence of plant food allergies: a
systematic review. J Allergy Clin Immunol 2008; 121: 1210-1218.
2. Gilissen LJWJ, Van der Meer IM, Smulders MJM. Reducing the incidence of
allergy and intolerance to cereals. J Cereal Sci 2014; 59: 337-353.
3. Sollid LM, Qiao SW, Anderson RP, et al. Nomenclature and listing of celiac
disease relevant gluten T-cell epitopes restricted by HLA-DQ molecules.
Immunogenetics 2012; 64: 455-60.
4. Koning F. Celiac disease: quantity matters. Semin Immunopathol 2012; 34: 541-
549.
5. Spaenij-Dekking L, Kooy-Winkelaar Y, van Veelen, P et al. Natural variation in
toxicity of wheat: potential for selection of nontoxic varieties for celiac disease
patients. Gastroenterology 2005; 129: 797-806.
6. Molberg O, Uhlen AK, Jensen T, et al. Mapping the gluten T-cell epitopes in the
bread wheat ancestors: implications for celiac disease. Gastroenterology 2005;
128: 393-401.
7. Van Herpen TWJM, Goryunova SV, Van der Schoot J, et al. Alpha-gliadin genes
from the A, B and D genomes of wheat contain different sets of celiac disease
epitopes. BMC Genomics 2006; 7: 1.
8. Mitea C, Salentijn EMJ, Van Veelen P, et al. A universal approach to eliminate
antigenic properties of alpha-gliadin peptides in celiac disease. PloS One 2010; 5:
e15637.
9. Salentijn EMJ, Mitea DC, Goryunova SV, et al. Celiac disease T-cell epitopes
from gamma-gliadins: immunoreactivity depends on the genome of origin,
transcript frequency, and flanking protein variation. BMC Genomics 2012; 13:
277.
10. Tye-Din JA, Stewart JA, Dromey JA, et al. Comprehensive, quantitative mapping
of T cell epitopes in gluten in celiac disease. Science Transl Med 2010; 2: 41ra51.
11. Van den Broeck HC, De Jong HC, et al. Presence of celiac disease epitopes in
modern and old hexaploid wheat varieties: wheat breeding may have contributed
to increased prevalence of celiac disease. Theor Appl Genet 2010; 121: 1527-1539.
12. Vader W, Kooy Y, Van Veelen P, et al. The gluten response in children with
celiac disease is directed towards multiple gliadin and glutenin peptides.
Gastroenterology 2002; 122: 1729-1737.
13. Camarca A, Anderson RP, Mamone G, et al. Intestinal T-cell responses to gluten
peptides are largely heterogeneous: implications for a peptide-based therapy in
celiac disease. J Immunol 2009; 182: 4158-4166.
14. Van den Broeck HC, Gilissen LJWJ, Smulders MJM, et al. Dough quality of bread
wheat lacking alpha-gliadins with celiac disease epitopes and addition of celiacsafe
avenins to improve dough quality. J Cereal Sci 2011; 53: 206-216.
15. Van den Broeck HC, Chen HB, Lacaze X, et al. In search of tetraploid wheat
accessions reduced in celiac disease-related gluten epitopes. Mol BioSystems 2010;
6: 2206-2213.
16. Vincentini O, Borrelli O, Silano M, et al. T-cell response to different cultivars of
farro wheat, Triticum turgidum ssp. Dicoccum, in celiac disease patients. Clin Nutr
2009; 28: 272-277.
17. Zanini B, Petroboni B, Not T, et al. Search for atoxic cereals: a single blind, crossover
study on the safety of a single dose of Triticum monococcum, in patients with
celiac disease. BMC Gastroenterol 2013; 13: 92.
18. Salentijn EMJ, Esselink DG, Goryunova SV, et al. Quantitative and qualitative
differences in celiac disease epitopes among durum wheat varieties identified
through deep RNA-amplicon sequencing. BMC Genomics 2013; 14: 905.
19. Wang JR, Luo MC, Chen Z, et al. Aegilops tauschii single nucleotide
polymorphisms shed light on the origins of wheat D-genome genetic diversity and
pinpoint the geographic origin of hexaploid wheat. New Phytol 2013; 198: 925-
937.
20. Jones H, Gosman N, Horsnell R, et al. Strategy for exploiting exotic germplasm
using genetic, morphological, and environmental diversity: the Aegilops tauschii
Coss. example. Theor Appl Genet 2013; 126: 1793-1808.
21. Van den Broeck HC, van Herpen TWJM, Schuit C, et al. Removing celiac
disease-related gluten proteins from bread wheat while retaining technological
properties: a study with Chinese Spring deletion lines. BMC Plant Biol 2009; 9:
41.
22. Becker D, Wieser H, Koehler P, et al. Protein composition and techno-functional
properties of transgenic wheat with reduced alpha-gliadin content obtained y RNA
interference. J Appl Bot Food Qual 2012; 85: 23-33.
23. Gil-Humanes J, Pistón F, Tollefsen S, et al. Effective shutdown in the expression
of celiac disease-related wheat gliadin T-cell epitopes by RNA interference. Proc
Natl Acad Sci USA 2010; 107: 17023-17028.
24. Piston F, Gil-Humanes J, Rodriguez-Quijano M, et al. Down-regulating gammagliadins
in bread wheat leads to non-specific increase in other gluten proteins and
has no major effect on dough gluten strength. PloS One 2011; 6: e24754.
25. Gil-Humanes J, Piston F, Gimenez MJ, et al. The introgression of RNAi Silencing
of gamma-gliadins into commercial lines of bread wheat changes the mixing and
technological properties of the dough. PloS One 2012; 7: e45937.
26. Gil-Humanes J, Pistón F, Altamirano-Fortoul R, et al. Reduced-gliadin wheat
bread: an alternative to the gluten-free diet for consumers suffering gluten-related
pathologies. PLoS One 2014; 9: e90898.
27. Wen S, Wen N, Pang J, et al. Structural genes of wheat and barley 5-
methylcytosine DNA glycosylases and their potential applications for human
health. Proc Natl Acad Sci USA 2012; 109: 20543-20548.
28. Hazard B, Zhang X, Colasuonno P, et al. Induced mutations in the Starch
Branching Enzyme II (SBEII) genes increases amylase resistant starch content in
durum wheat. Crop Sci 2012; 52: 1754-1766.
29. Henry IM, Nagalakshmi U, Lieberman MC, et al. Efficient genome-wide detection
and cataloging of EMS-induced mutations using exome capture and nextgeneration
sequencing. Plant Cell 2014; 26: 1382-1397.
30. Morita R, Kusaba M, Iida S, et al. Molecular characterization of mutations induced
by gamma irradiation in rice. Genes Genet Syst 2009; 84: 361-370.
31. Cockram J, Mackay IJ, O’Sullivan DM. The role of double-stranded break repair
in the creation of phenotypic diversity at cereal VRN1 loci. Genetics 2007; 177: 1-
5.
32. Zhou H, Liu B, Weeks DP, et al. Large chromosomal deletions and inheritable
small genetic changes induced by CRISPR/Cas9 in rice. Nucleic Acid Res 2014;
42: 10903-10914.
33. Belhaj K, Chaparro-Garcia A, Kamoun S, et al. Plant genome editing made easy:
targeted mutagenesis in model and crop plants using the CRISPR/Cas system.
Plant Methods 2013; 9: 39.
34. Wang Y, Cheng X, Shan Q, et al. Simultaneous editing of three homoeoalleles in
hexaploid bread wheat confers heritable resistance to powdery mildew. Nature
Biotechnol 2014; 32: 947-952.
35. Van den Broeck HC, Cordewener JHG, Nessen MA, et al. Label free targeted
detection and quantification of celiac disease immunogenic epitopes by mass
spectrometry. J Chromatol A 2015, 1391: 60-71.
4.6 Potential of wild wheat relatives in coeliac research
Gyöngyvér Gell1, Krisztina Kovács1 and Angéla Juhász1
Agricultural Institute, CAR, HAS, Martonvásár, Hungary
Introduction
Prolamins constitute the main endosperm storage proteins in wheat, barley, rye, and
maize, while globulins are the predominant storage proteins in oat and rice, accounting
for about 70 - 80% of the total protein [1]. The classification method of Shewry et al.
[2] divides them into three distinct groups, namely the sulphur (S)-rich, S-poor
prolamins, and high-molecular-weight (HMW) glutenins. - and -gliadins are the
main protein families with respect to coeliac disease (CD) [3,4]. These proteins
contain a number of T-cell stimulatory epitopes, mostly in their repetitive regions [5-
7]. To date, the only effective treatment of CD is a lifelong gluten-free diet for people
suffering from CD.
Wild Aegilops species are excellent resources for pre-breeding, serve as valuable
sources of biotic and abiotic stress resistance, can serve as excellent sources for
enhanced micronutrient content, and may be beneficial in chronic disease prevention.
Next to the quality-related issues, several studies are focused on the determination of
the toxic potential of wheat genome donors. Most of these studies were focusing on
single protein families, such as - or -gliadins [8-10]. Based on several studies [8-12]
a large amount of genetic variation exists among diploid wheat species, including the
ancestors of bread wheat, in CD-triggering prolamins. It is, therefore, worthwhile to
screen for Aegilops genotypes with reduced CD activity in a complex way.
Materials and methods
Different Triticum and Aegilops seeds were derived from the Cereal Gene Bank of the
Department of Plant Genetic Resources and Organic Breeding, Martonvásár. Crude
protein contents were determined using the Dumas method in triplicates.
In case of total protein extracts, proteins were extracted with SDS buffer followed the
protocol Dupont and co-workers 2011 [13], which extracted a greater percentage of
protein from wheat flour than other methods and facilitated removal of starch.
After the electrophoresis, the proteins were transferred to ImmobilonP PVDF
membrane and IgA based immunoblot were carried out. Patient’s sera suffering from
CD obtained from Dr. Gábor Veres (1st Department of Pediatrics, Semmelweis
University of Medicine) and Dr. Korponay-Szabó Ilma (Heim Pál Children’s Hospital,
Coeliac Centre). In this study, sera of two CD-negative, of three CD-positive patients
on a gluten-free diet and of five CD-positive patients on a normal diet were used for the estimation of the toxic potential of the total protein extracts of the seeds of the
wheat relatives.
Immunodetection by ELISA was made with two different commercially available
ELISA kits. The R5 Ridascreen Gliadin (R-Biopharm, Germany) sandwich enzyme
immunoassay and AgraQuant Gluten G12 (Romer Labs, Austria) sandwich enzyme
assays were used to determine the toxic peptide content of prolamin extracts of the
investigated genotypes. The analysis was performed according to the manufacturers´ instructions. For each genotype, calculated gliadin contents determined by the ELISA
assays were normalised by the protein contents. Values obtained for the hexaploid
cultivar ‘Chinese Spring’ were used as a measure of toxic R5 and G12 peptide content
and obtained gliadin contents were normalised against the value of the control line ‘Chinese Spring’. These relative values were used to compare toxic protein contents of
the investigated genotypes.
The storage protein sequences of the investigated genotypes were retrieved from the
UniProt database (http://www.uniprot.org/) and analysed with the ProPepper software
(propepper.net), searching linear epitopes. The toxic peptides, resulting from the
bioinformatics analyses, served as a basis of the motif list, which was created with
CLC Genomic Workbench 3.6.5. The motif search on the aligned storage proteins
resulted in the epitope map of the selected genotypes. To simulate gastrointestinal
digestion, proteins were analysed for potential cleavage sites using the Expasy
PeptideCutter tool [14]. Endopeptidases such as trypsin, pepsin (pH 1.3), and
chymotrypsin were involved simultaneously in the in silico digestion analysis, and
epitopes that were resistant to the enzymatic cleavage were identified.
Results and discussion
Different Triticum and Aegilops genotypes were investigated in our study using
bioinformatics, proteomics, and immunomics. Several other studies have focused on
the allergen behaviour and toxic nature of the storage proteins of different cereal
species, like Aegilops tauschii, Triticum monococcum, and Triticum urartu gliadins [1-
5]. Most of these studies were focused on individual protein subclasses, primarily the
alcohol-soluble fraction of the seed storage proteins. In our case, all of the major
prolamin subclasses were analysed with bioinformatics methods, in this way we can
get more information on the toxic potential of storage proteins. ELISA-based gluten
tests are widely accepted for the determination of gluten contamination in gluten-free
and low gluten food samples. Depending on the antibodies used, the assays are
measuring a specific protein type, a single peptide motif or a peptide set specific for a
group of gluten proteins. Recent in silico studies proved that all the Osborne fractions
may contain proteins with toxic epitopes [15-16], however, their number and
expressed amount varies. Both the epitope mapping analyses and the ELISA assays
results confirm that epitope content of species from the same ploidy level show high
variability. While species, related to the A and M genomes (T. urartu, T. monococcum,
Ae. comosa), have the lowest R5 and G12 epitope contents, the U and B genomes in diploid species show higher R5 epitope contents. Even though the highest number of
epitopes was found in the cysteine mutant -gliadins and some -gliadins of T.
aestivum, these sequence variations were less frequent.
T. monococcum, T.urartu, and Ae.comosa were identified to have significantly lower
gliadin content as per ELISA methods using antibodies against confirmed toxic
epitopes. (Fig. 1). Because of the contrary results of the ELISA assay, a broad range of
bioinformatics analyses and epitope mapping were made based on the publicly
available prolamin sequences. High diversity in the toxic epitope content and
distribution between the investigated species was found. -Gliadins showed the highest
pattern diversity, with 11 different epitope patterns in T. aestivum, 8 in Ae. tauschii
and 7 in T. monococcum. More detailed information about the ELISA assays and the
bioinformatics analyses can be found in Gell et al. [17], recently published.

Figure 1. Comparison of the toxic epitope content of different genotypes. Relative
values were obtained by normalising the obtained gliadin contents from G12 and R5
ELISAs against the value of cv. ‘Chinese spring’ (= 0)
The results of the immunoblots with human sera derived from CD patients
strengthened the results of the bioinformatics analyses. In all of the investigated
genotypes, strong CD-associated proteins with all of the individual sera were found
(Fig. 2). There were differences between the blot pattern of Triticum and Aegilops
species. In contrast to the ELISA assay results, Ae. urartu was the one of the most
immunoreactive species. The ELISA assays, performed in this study, were used to
characterise selected species with different genomic backgrounds. However, the high variation in epitope frequencies of sequences within the same species, obtained by
bioinformatics analyses, highlighted the importance of analysis at the genotypic or
accession level. Identification of new prolamin alleles of various wheat species and
wild relatives is of great importance in order to find germplasm suitable to grow in
different environmental conditions and also to find breeding sources suitable for
special end-use requirements of consumers with gluten sensitivity. The joint sequential
and immunoanalytical study of cereals and wild wheat relatives has both analytical and
clinical implications. First of all, our results provide further confirmation of the
considerable variability in expression of CD-specific peptides of cereals with different
genetic backgrounds. Besides, the results show further variability depending on the
antibody used. These results highlighted the fact that the reliability of
immmunoanalytical results may be dependent on the variety of the sample and the
method used. Today, the ELISA methodology is used to determine whether food
products, intended for CD patients, contain gluten below the regulated threshold levels
of 20 and 100 mg/kg gluten for gluten-free and low gluten foods, respectively. Thus,
based on our results, it would be important to reveal, how this variability affects the
analytical results in this low mg/kg range. This is even more important for the species
that are showing lower ELISA gliadin values, or none at all, as in the case of T.
monococcum.
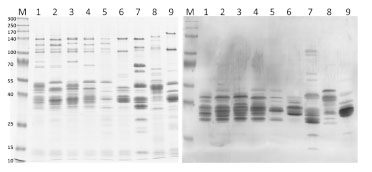
Figure 2. SDS-PAGE of the investigated genotypes and immunoblot with IgA of
selected prolamin extracts of genotypes with CD patients´ sera. 1. T. aestivum -
Chinese Spring; 2. T. aestivum – Bánkúti; 3. T. aestivum – Spelt1; 4. T. aestivum– Spelt2; 5. T. turgidum ssp. dicoccum – Fehér tönke; 6. Aegilops tauschii - MVGB-589;
7. T. urartu - MVGB-115; 8. Aegilops speltoides – MVGB 1321; 9. Aegilops speltoides – MVGB 1147: M. Marker proteins
Conclusions
In this study, G12 and R5 commercially available ELISA test kits were used. There
were strong differences between the results of these kits and between the different
species, too. Based on our epitope mapping analyses there is a significant number of
sequences that do not contain the toxic peptides used for monoclonal antibody
production (R5 – QQPFP; G12 - QPQLPY). Additionally, the R5 peptide was also
present in the m-type LMW glutenins that were not represented in the gliadin standard
used for calibration of the R5 mAb-specific ELISA assay. Hence, the tests using R5
and G12 mAbs are underestimating the gluten content of the analyzed samples. The
level of this underestimation strongly depends on the expressed amounts of these
peptides, which is a factor influenced by the types and number of unique proteins and
their expression level. Based on the results of the bioinformatics and immunomics
analyses, some diploid and tetraploid species were identified that have significantly
lower gliadin content as per ELISA methods using antibodies against confirmed toxic
epitopes. Independently from the ploidy level, none of them is suitable for patients
suffering from CD due to the high toxic epitope content and strong immunoreactive
behaviour.
Due to the evolving time of ancestral grasses and the monophyletic origin of the
prolamin gene family, it is hard to believe to find any safely edible cereals in the
Pooideae subfamily for patients suffering from CD. However, a reduced toxic peptide
content of diploid and tetraploid species and genotypes would already delay the
induction of the disease in young children.
In summary, our results can only serve as a pilot study to investigate the epitope
content of wheat-related species. Some of the analysed accessions seem to contain
remarkably lower levels of gliadin compared to bread wheat. However, these levels are
still higher than the 20 mg/kg gluten level, which is required for the gluten-free
declaration of a product. Still, these species can be ideal candidates for breeding new
varieties with a lower toxic epitopes content, this way providing new dietary
supplements for CD patients. However, before that point could be reached, their
potentially lower toxicity must be confirmed by in vitro or in vivo studies.
Additionally, variability in allergen content and effect of environmental changes on
allergen protein content of the different species should be determined. Also, effects of
food processing and subsequent gastrointestinal digestion on the toxic epitope content,
on their biological reactivity, and on detectability are important.
Acknowledgement
This project was supported by the European Union and co-financed by the European
Social Fund TÁMOP-4.2.2.A-11/1/KONV-2012-0008. Gyöngyvér Gell would like to
thank for the support of the MTA Post Doctoral Fellowship Program. Angéla Juhász
was supported by the TÁMOP-4.2.4.A/2-11/1-2012-0001 grant.
References
1. Shewry PR, Halford NG. Cereal seed storage proteins: structures, properties and
role in grain utilization. J Exp Bot 2002; 53:947-958.
2. Shewry, P.R., Tatham, A.S. & Halford, N.G. The prolamins of the Triticeae. In:
Seed Proteins, (eds. P.R.Shewry & R.Casey) Kluwer Academic Publishers,
Dordrecht, The Netherlands, 1999; pp. 35-78.
3. Chand N, Mihas A. Celiac disease: current concepts in diagnosis and treatment. J
Clin Gastroenterol 2006; 40: 3-14.
4. Catassi C, Fasano A. Celiac disease. In: Arendt EK, Dal Bello F (eds) Gluten-free
cereal products and beverages. Elsevier, Burlington, USA, 2008; pp 1-22.
5. Arentz-Hansen H, Korner R, Molberg O, et al. The intestinal T cell response to
alpha-gliadin in adult celiac disease is focused on a single deamidated glutamine
targeted by tissue transglutaminase. J Exp Med 2000; 191: 603-612.
6. Arentz-Hansen H, McAdam S, Molberg J, et al. Celiac lesion T cells recognize
epitopes that cluster in regions of gliadins rich in proline residues.
Gastroenterology 2002; 123(3): 803-809.
7. Mitea C, EMJ Salentijn, P van Veelen, et al. A universal approach to eliminate
antigenic properties of alpha-gliadin peptides in celiac disease. PLoS ONE 2010;
5(12): e15637.
8. Molberg O, Uhlen AK, Jensen T, et al. Mapping of gluten T cell epitopes in the
bread wheat ancestors: implications for celiac disease. Gastroenterology 2005;
128: 393-401.
9. Goryunova SV, Salentijn EMJ, Chikida NN, et al. Expansion of the gammagliadin
gene family in Aegilops and Triticum. BMC Evol Biol 2012; 12: 215.
10. Salentijn EMJ, Mitea DC, Goryunova SV, et al. Celiac disease T cell epitopes
from gamma-gliadins: immunoreactivity depends on the genome of origin,
transcript frequency, and flanking protein variation. BMC Genomics 2012; 13:
277.
11. Salentijn EMJ, Esselink DG, Goryunova SV, et al. Quantitative and qualitative
differences in celiac disease epitopes among durum wheat varieties identified
through deep RNA-amplicon sequencing. BMC Genomics 2013; 14: 905.
12. Van Herpen, Goryunova SV., van der Schoot J et al. Alpha-gliadin genes from the
A, B, and D genomes of wheat contain different sets of celiac disease epitopes.
BMC Genomics 2006; 7: 1.
13. Dupont FM, Vensel WH, Tanaka CK, et al. Deciphering the complexities of the
wheat flour proteome using quantitative two-dimensional electrophoresis, three
proteases and tandem mass spectrometry. Proteome Sci 2011; 9 (10): 1-29.
14. Gasteiger E, Hoogland C, Gattiker A, et al. Protein identification and analysis
tools on the ExPASy Server. In: Walker JM (ed) The proteomics protocols
handbook. Humana Press, Totowa 2005; pp. 571-607.
15. Juhász A, Gell Gy, Sebestyén E, et al. Brachypodium distachyon as a model for
defining the allergen potential of non-prolamin proteins. Funct Integr Genomics
2012; 12: 439-446.
16. Juhász A, Gell G, Békés F, et al. The epitopes in wheat proteins for defining toxic
units relevant to human health. Funct Integr Genomics 2012; 12: 585-598.
17. Gell G, Kovács K, Molnár I, et al. Celiac disease-specific prolamin peptide
content of wheat relatives and wild species determined by ELISA assays and
bioinformatics analyses. Cereal Res Commun 2014; 43; doi:
10.1556/CRC.43.2015.1.13.
4.7 ProPepper - A database for identification of peptide
and epitope composition of cereal grain proteins
Angéla Juhász1, Réka Haraszi 2, Csaba Maulis3
1 Applied Genomics Department, CAR, HAS, Martonvásár, Hungary
2 Campden BRI, Chipping Campden, UK
3 Enterpreneur developer, Budapest, Hungary
Introduction
Gluten proteins, especially their prolamin content, are responsible for severe health
problems, like coeliac disease (CD) and partially for wheat allergy (WA). Prolamin
proteins, like high- and low-molecular-weight glutenins, -, -, and - gliadins share
high degree of sequence similarity, based on which the precise identification of unique
alleles is really challenging. The detection of gluten proteins is extremely important
not only due to their direct effect on end-use quality but also for food safety reasons.
Variability of grain composition of cereal genotypes leads to methodological problems
in food allergen research and genotype selection in breeding for quality. Due to the
high sequence homology in seed protein sequences of cereal species, the exact
identification of proteins that are involved in cereal allergy and gluten intolerance,
their genotypic frequency, variability and stability are not known due to limitations in
the used methodology. High-resolution methods such as mass spectrometry (MS)
require accurate molecular quantitative relationships in order to relate the detection of
peptide mass to their protein sources. Quantitative relationships between prolamin
peptide biomarkers and the final gluten/prolamin content are difficult to establish due
to genotypic and environmental variability. Additionally, their special amino acid
composition, the significantly higher portion of proline and glutamine residues, has led
to poor digestibility by trypsin, one of the most commonly used enzyme in MS-based
proteomics. Many of these peptides, identified from different prolamin types, were
proven to be immunoreactive in patients suffering in CD or wheat allergies. In order to
assist peptide biomarker search, a database (ProPepper™, popepper.net) was
developed that contains members of the prolamin superfamily proteins identified from
Poaceae species, peptides obtained with multi-enzyme in silico digestion as well as
linear epitopes responsible for wheat-related food disorders.
Materials and methods
The ProPepper database contains three sets of databases (proteins, peptides, and
epitopes) that are cross-connected. 2072 complete protein sequences, all members of
the prolamin superfamily, isolated from different Poaceae, were retrieved from the
Uniprot database. Sequences were aligned for a precise identification of the protein
types. Misannotations were corrected and information related to chromosomal location, origin and allele were added using Genbank information and published
results. Chromosomal origin of proteins, retrieved from Triticum species, were blasted
against the wheat genome survey sequence database.
An application, the Protein Digestion Multi Query, was also developed for in silico
digestion of the protein dataset. Enzymes, like trypsin, pepsin (pH 1.3), and
chymotrypsin (low specificity), were applied in different combinations allowing
simultaneous application of the enzymes. By the in silico digestion of the protein
dataset currently 25303 unique peptide sequences provide the peptide database in
Propepper as a result of 408 655 unique digestion events with only these three
enzymes.
The third component is the epitope database that contains 43 CD-related core epitopes
and the integration of 414 gluten-related T-cell epitopes is in progress.
These three datasets are related by unique IDs in order to analyse prolamin
characteristics at species and genotype level; to identify peptides resistant to
gastrointestinal enzymes; to identify peptides suitable for MS-based marker analyses;
and to identify epitopes at unique protein or peptide level. Some examples of the use
of epitope dataset and peptide dataset are presented below.
Results and discussion
Epitope module
The ProPepper database and analysis platform is suitable to provide answers related to
the epitope content of unique genotypes, to determine differences in the toxicity of the
different species, as well as to determine prevalence of unique epitopes or peptides in
the different prolamin protein families. In order to analyse the toxicity of unique
genotypes, either protein sequences isolated from the asked genotype or the allelic
composition of Glu-1, Glu-3, Gli-1, and Gli-2 loci should be known. For example,
genotypes with partial or complete allelic identity to cv. ‘Chinese Spring’ show the
epitope characteristics of ‘Chinese Spring’.
Two species, Triticum aestivum and Aegilops tauschii both with a significant amount
of protein sequence data, were used to compare the core epitope content in Poaceae
species. Protein sequences of the different prolamin types were analysed separately.
Prevalence of sequences without core epitopes was determined as well as epitope
density measured. Although -gliadins are considered to be the primary cause of
gluten toxicity, our results have confirmed that epitopes are common in all the
prolamin protein types (Fig. 1). However, while about 90% of the -gliadins in T.
aestivum contain at least one core epitope, the number of protein sequences without
core epitopes is higher in Ae. tauschii. On the other hand, in T. aestivum only about
50% of high-molecular-weight glutenin subunits (HMW-GS) contain core epitopes.
These toxic peptides are more frequent in the Ae. Tauschii HMW-GS. When the count
of unique core epitopes contains all three gliadins groups, generally a larger number of core epitopes was identified in Ae. tauschii sequences compared to the bread wheat
sequences. In case of low-molecular-weight glutenin subunits (LMW-GS) the
prevalence of epitopes is significantly higher in bread wheat sequences than in Ae.
tauschii sequences. These differences can serve as an indicator to the different toxicity
of the A, B, and D genomes but can also be related to the underutilised allele sources
present in Ae. tauschii.
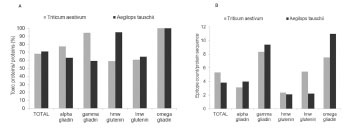
Figure 1. Differences in the prevalence and frequency of known core epitopes in
prolamin protein types of bread wheat (T. aestivum) and Ae. tauschii. A- Ratio of
protein sequences with core epitopes in the different prolamin types; B - Number of
epitopes present in a sequence
Additional analysis was performed to determine the prevalence and frequency of the
QQPFP peptide monoclonal antibody (mAb) R5 in the different prolamin types and
cereal species. Six Aegilops species with different genome composition and four
Triticum species were used in the analysis. Prolamin types were analysed separately.
Based on our results, the R5 monoclonal antibody is specific for four different
prolamin types: LMW-GS, -, -, and -gliadins. The presence of the QQPFP peptide
was identified in 25% of LMW-GS, 80% of -gliadins, and nearly all - and -
gliadins (Tab. 1). This may result in an underestimation of the gliadin content, when
the R5 mAb is used. ELISA kits working with R5 mAb were developed to be specific
on gliadins. However, our bioinformatics analyses have confirmed that the
25% of LMW-GS that contain this peptide belong to the m-type subunits, which are
common in all wheat genotypes and their expressed amount is responsible for the
majority of the LMW-GS proteins. These results strongly confirm that, although the
number and distribution of CD-related core epitopes show a significant variability in
the different prolamin types and in the different species, their presence is common in
all prolamin types. Therefore, gliadin specific ELISAs working with mAbs need
markers that are present in all the gliadin sequences but are absent in glutenin
sequences.
Table 1. Prevalence (%) of the R5 peptide (QQPFP) in the different prolamin types of
Aegilops and Triticum species.
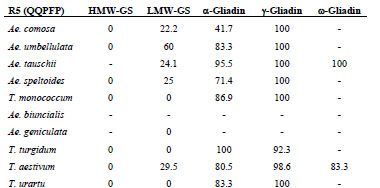
MS module
The Propepper database can be a useful tool in the design and evaluation of MS-based
proteomics workflow, when analysing cereals for prolamin proteins and peptides. The
application of Propepper is not entirely replacing the experimental phase of such
workflow but can be useful, when expert knowledge of prolamins is not available.
This concerns the design of a digestion method prior to MS analysis, targeted multiple
reaction monitoring (MRM) method developments or the data processing of a mass
spectrum and the identified masses. The in silico digested peptide content of the
Propepper helps to select target peptides and the best enzymes, when optimising a
digestion method, as well as to identify the specificity of the identified peptides by a
search engine or data processing algorithm. Since the peptides in Propepper were
blasted for specificity, the initial workflow for a targeted MRM approach in order to
establish a candidate peptide marker list can be achieved by Propepper.
In a discovery work, the list of identified masses from a mass spectrum needs to be
related to a peptide sequence and a protein source. This information is in a database
that is selected by the user and contains protein sequences most frequently in fasta
format. The quality of this database is very important. The database size and the
specificity of the data entries are all influencing the final scores during the matching
process. This score is usually optimised for trypsin digestions, so in case of other
enzyme(s) used; the meaning of this score is limited. Propepper offers the opportunity
to relate peptide masses to a genotype or species via the identification of individual
peptides and its protein source even at allelic level (Fig. 2).
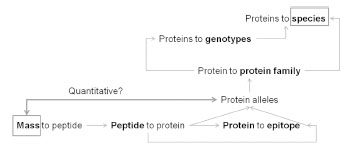
Figure 2. Relationships among data that can be obtained from the Propepper
database
Monoisotopic mass information entered to Propepper will show all related connections
to potential peptide sequences, digestion events, proteins, and genotypes. By entering
the mass in the relevant search field of the Propepper database, the hits appear real
time. Then, by the selection of the peptide, the relevant sequence and other annotated
information will be available. Fig. 3 shows the first step of such mass search and a
summary of the results obtained from Propepper.
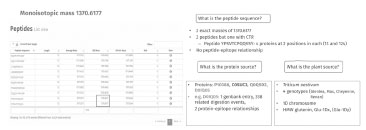
Figure 3. Case study of how to use peptide mass entries in the Propepper database to
establish its relevance to peptides, proteins, genotypes, and species
Conclusions
Propepper is a regularly maintained, manually curated expert database of prolamin
peptides, epitopes, and proteins that combines the knowledge of 5+ well-known and
acknowledged databases. It provides a great tool for proteomics, MS, and clinical
experts that are dealing with prolamins, this unique and complex protein family.
Currently linear T-cell-related epitopes are included in the database, mostly connected
with CD-specific symptoms. Incorporation of linear B-cell-related epitopes will also enhance our understanding about gluten peptides involved in cereal related food
disorders.
The quantitative relationships of peptides and proteins are still missing and would
provide valuable information to monitor quantitative changes in peptides of genotypes
and species using quantitative mass spectrometry.
Acknowledgements
Angéla Juhász was supported by the TÁMOP-4.2.4.A/2-11/1-2012-0001 grant.
References
16. Edens L, Van der Hoeven R, De Ros AL, et al. Use of proline-specific
endoproteases to hydrolyse proline-rich peptides at acid pH in food processing.
Patent No, 2005/027953.
17. Lopez M, Edens L, Effective Prevention of Chill-Haze in Beer Using an Acid
Proline-Specific Endoprotease from Aspergillus niger. J Agric Food Chem 2012,
53: 7944-7949.
18. Hartmann G, PhD Thesis: Abbau von Getreidespeicherproteinen durch endogene
Peptidasen. Technische Universität München, 2009; pp. 134-194.
19. Gessendorfer B, Hartmann G, Wieser H, et al. Determination of celiac diseasespecific
peptidase activity of germinated cereals. Eur Food Res Technol 2011, 232:
205-209.
20. Schwalb T, Wieser H, Koehler P. Studies on the gluten-specific peptidase activity
of germinated grains from different cereal species and cultivars. Eur Food Res
Technol 2012, 235: 1161-1170.
4.8 Optimisation of proteomic protocols for the analysis of gluten
M. Carmen Mena1, Manuel Lombardía1, Sergio Ciordia1, Juan P. Albar1†, Alberto
Paradela1
1 Proteomics Facility, Centro Nacional de Biotecnología, Consejo Superior de
Investigaciones Científicas, Madrid, Spain
†Deceased
Introduction
The accepted technique for the analysis of gluten in food samples is the R5 ELISA
assay [1,2], but immunological techniques present the common disadvantages
associated to antibody specificity and sensitivity. Applying proteomics to this field is
of great interest to complement other techniques and to achieve the maximum
accuracy in the analysis of gluten in foods.
There are several difficulties associated to the use of proteomics in the analysis of
prolamins and glutelins, including the limited number of sequences of wheat, barley,
and rye that are available in public databases. Appropriate sample preparation
procedures are also essential for a correct analysis of samples.
Prolamins are a complex mixture of proteins that are more difficult to analyse than
other proteins by standard mass spectrometry (MS) methods of analysis [3]. For
example, the high number of different gluten proteins is a rate-limiting step in
proteomics workflows. On the other hand, enzymatic digestion of proteins by
endoproteases is a key step in protein identification by MS techniques. Trypsin, the
enzyme mainly used for this purpose, cleaves C-terminal to lysine and arginine, but
these cleavage points are not appropriate for generating peptides of an optimum length
in the case of gluten proteins due to their low percentage of these amino acids [4] . For
that reason, the main objective of this study is to optimise different protocols using
proteases with different specificities to obtain a different set of gluten fragments in
order to achieve a complete characterisation of gluten proteins.
Materials and methods
We used the Working Group on Prolamin Analysis and Toxicity (PWG) gliadin
standard (2 mg/mL in 60% ethanol/water (v/v)). This standard is obtained from a
mixture of 28 wheat cultivars representative of the European wheat-producing
countries [5]. Flour from seeds of wheat (Triticum aestivum) was also used. To obtain
a fine homogenised powder, seeds were thoroughly ground with an IKA A11
analytical mill (IKA®, Staufen, Germany).
Proteins from wheat and PWG-gliadin standard were extracted, precipitated, and total
protein concentration was determined. Some of gluten proteins are aggregated in their
native form. For that reason and in order to get the maximum recovery of proteins, we
performed a denaturation step with guanidine. Tris(2-carboxyethyl)phosphine) (TCEP)
was used for reduction of disulphide bonds. Afterwards, gluten proteins were extracted
with 60% ethanol/water (v/v). Before digestion and in order to use the suitable amount
of enzyme to digest the samples it is essential to quantify the total amount of proteins.
For this purpose, we used the Pierce 660 nm Protein Assay, as this method is
compatible with most of the reagents used for protein extraction, including detergents
and reducing agents. Furthermore, we used iodoacetamide for alkylation of
sulphhydryl groups to prevent reformation of disulphide bonds.
In this study, we digested the samples with different proteases: trypsin (proteomics
grade, from porcine pancreas Sigma, T6567) that cleaves C-terminal to lysine (K) and
arginine (R); chymotrypsin (sequencing grade, from bovine pancreas, Roche), which
cleaves C-terminal to large hydrophobic residues (tyrosine (Y), tryptophan (W),
phenylalanine (F)) and leucine (L); and pepsin (from porcine gastric mucosa, Sigma,
P6887), which cleaves at the amino side of phenylalanine (F) and leucine (L). Trypsin
and chymotrypsin digestions were performed using a 1:10 enzyme:protein ratio at
37 °C overnight (12 - 16 h) on a shaker. Pepsin digestion was performed using a 1:20
enzyme:protein ratio at 37 °C for 6 h on a shaker. In addition, we performed a
combined digestion with two enzymes using first trypsin at a 1:10 enzyme:protein
ratio at 37 °C overnight (12 - 16 h) on a shaker followed by chymotrypsin at a 1:20
enzyme:protein ratio at 37 °C for 2.5 h on a shaker. Finally, a combined triple
digestion was performed, combining trypsin and chymotrypsin as detailed above,
followed by a final digestion step using pepsin at a 1:40 enzyme:protein ratio at 37 °C
for 1 h on a shaker.
The resulting peptide mixtures were desalted and cleaned tryptic peptides from insolution
digestion were evaporated to dryness. An aliquot of each digested sample was
subjected to triplicate nano LC ESI-MS/MS analysis using a nano liquid
chromatography system (Eksigent Technologies nanoLC Ultra 1D plus, AB SCIEX,
Foster City, CA) coupled to a high speed Triple TOF 5600 Q-TOF mass spectrometer
(AB SCIEX , Foster City, CA) with a duo spray ionisation source. The C18 nanocolumn
was a silica-based reversed-phase column and for this analysis, a trap column
was included switched on-line with the nano-column. The flow rate and gradient
elution were optimised for these samples. MS and MS/MS spectra, obtained for
individual samples in unprocessed form, were converted to Mascot generic form files
using PeakView software v.1.1, followed by a search against the Triticum National
Center for Biotechnology Information (NCBI) database (2014_July - 43799 protein
sequences), using a licensed version of Mascot v.2.5.0. (www.matrixscience.com;
Matrix Science, London, UK) as search engine.
Results and discussion
The extraction of gluten in wheat, barley, and rye standards is more affordable than in
processed foods. 60% ethanol/water is particularly useful to extract prolamins, which
are the alcohol-soluble proteins of gluten (wheat gliadins, barley hordeins, and rye
secalins). In addition, under reducing conditions solutions together with the prolamins,
the main extractions are the polymeric hight-molecular-weight (HMW-) and lowmolecular-
weight (LMW-) glutenin fractions and their equivalents in barley and rye
[6]. In this study, we analysed all the fractions.
We have compared the number of gluten proteins identified using different proteases
and their combinations. Trypsin and chymotrypsin digestions were performed
according to proteomics literature. Pepsin digestion required a shorter incubation time
and a lower enzyme: substrate ratio than digestions with trypsin and chymotrypsin to
avoid a complete digestion of peptides, but even under these conditions, we observed
that proteins were extensively digested, resulting in very short fragments amenable for
identification of most of the proteins (Tab. 1 and Tab. 2). Therefore, pepsin digestion,
using the described conditions, is not the method of choice for gluten identification by
MS techniques.
As expected, wheat contains a greater number of different total proteins (Tab. 1) than
those found in the PWG-gliadin reference (Tab. 2). Nevertheless, we observed in the
PWG standard a significant number of glutenins and other proteins indicating that
even though the standard is processed in order to obtain only the gliadin fractions of
gluten, there are other types of proteins that remain in the standard (Tab. 2).
Table 1. Total number of proteins and number of gluten proteins (glutenins or
gliadins) identified in wheat, using different enzymes for digestion of proteins.
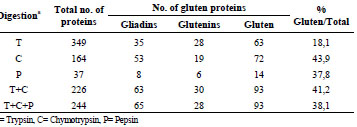
The percentage of gluten proteins identified in the wheat extracts changes according to
the enzyme used. According to our results, the use of chymotrypsin gives more
information than trypsin, and there is a higher number of identified proteins with any
of the enzyme combinations (Tab. 1). Other studies have used chymotrypsin for
identifying gluten proteins and provided interesting results [7].
Fig. 1 represents the number of common and unique proteins found in wheat extracts
digested with different enzymes. It is important to notice that each method generates
complementary information and therefore, the use of more than one method in parallel
is useful for a more exhaustive analysis of the sample. Quite unexpectedly, low
overlap between the set of proteins identified using either trypsin or chymotrypsin was
found, probably due to the very different residue specificity (Fig. 1).
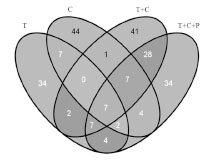
Figure 1. Comparative analysis of the numbers of unique and common different gluten
proteins identified in wheat using different enzymes for digestion of proteins. T=
Trypsin, C= Chymotrypsin, P= Pepsin
The percentage of gluten proteins identified in the PWG-gliadin reference was higher
than in the wheat extract using any of the enzymes. Approximately 80% of the
proteins identified using chymotrypsin, alone or in combination with other proteases,
correspond to gluten proteins. However, our results indicate that there are other
proteins present in this standard.
Table 2. Total number of proteins and number of gluten proteins (glutenins or
gliadins) identified in PWG-gliadin, using different proteolytic experimental
strategies.
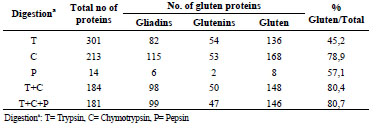
As described in Fig. 1 for wheat extracts, results summarized in Fig. 2 show that the
use of different proteases produces complementary information.
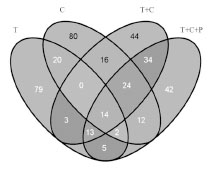
Figure 2. Comparative analysis of the numbers of unique and common different gluten
proteins identified in PWG-gliadin using different enzymes for digestion of proteins.
T= Trypsin, C= Chymotrypsin, P= Pepsin
As shown in Tab. 1 and 2, the use of proteases other than trypsin increases the number
of identified proteins including those related with toxicity for coeliacs such as / and -gliadins and LMW-glutenins. According to our results, the most suitable method in
order to get the maximum coverage of proteins is the use of a combination of more
than one digestion protocol.
Conclusions
Even though digestion with chymotrypsin yields a higher number of identified gluten
proteins, trypsin also provides interesting information. Thus, there are unique proteins
identified with every type of enzyme used for digestion. Apart from pepsin, the other
proteases studied (trypsin, chymotrypsin, and their combinations) are useful for
proteomic analysis of gluten proteins. The combination of trypsin and chymotrypsin is
the digestion method of choice to identify a high number of gluten proteins in wheat
by MS techniques. In addition, there are other proteins different from gliadins in the
PWG-gliadin reference.
In conclusion, in order to achieve the maximum information of the sample, it should
be useful to use more than one digestion method in parallel. Depending on the protease
used, the sequence coverage obtained is different.
References
1. Mena MC, Lombardia M, Hernando A, et al. Comprehensive analysis of gluten in
processed foods using a new extraction method and a competitive ELISA based on
the R5 antibody. Talanta 2012; 91: 33-40.
2. Valdes I, Garcia E, Llorente M, et al. Innovative approach to low-level gluten
determination in foods using a novel sandwich enzyme-linked immunosorbent
assay protocol. Eur J Gastroenterol Hepatol 2003; 15: 465-474.
3. Belitz HD, Grosch W, Schieberle P. Food Chemistry: Springer 2004.
4. Salplachta J, Marchetti M, Chmelik J, et al. A new approach in proteomics of
wheat gluten: combining chymotrypsin cleavage and matrix-assisted laser
desorption/ionization quadrupole ion trap reflectron tandem mass spectrometry.
Rapid Commun Mass Spectrum 2005; 19: 2725-2728.
5. van Eckert R, Berghofer E, Ciclitira PJ, et al. Towards a new gliadin reference
material–isolation and characterisation. J Cereal Sci 2006; 43: 331-341.
6. Wieser H. Chemistry of gluten proteins. Food Microbiol 2007; 24: 115-119.
7. Rombouts I, Lagrain B, Brunnbauer M, et al. Improved identification of wheat
gluten proteins through alkylation of cysteine residues and peptide-based mass
spectrometry. Sci Rep 2013; 3: 2279.
4.9 Oxidation of 33-mer peptide
Xin Huang, Päivi Kanerva, Hannu Salovaara, Tuula Sontag-Strohm
University of Helsinki, Helsinki, Finland
Introduction
Prolamins have relatively high resistance to breakdown by gastric and pancreatic
enzymes. Shan et al. [1] digested -gliadin, using gastric and pancreatic enzymes, and
analysed the resulting peptides with liquid chromatography and mass spectrometry. A
peptide of 33 amino acids (LQLQPFPQPQLPYPQPQLPYPQPQLPYPQPQPF, 2-
gliadin, residue 56-88) remained intact, while most other fragments were cleaved into
small peptides. This peptide, the 33-mer, has three epitopes, PFPQPQLPY,
PYPQPQLPY (two copies), PQPQLPYPQ (three copies) that stimulate coeliac
disease- (CD) active T cells. It is anticipated that the breakdown of 33-mer into small
peptides can reduce its toxicity.
A proline-endopeptidase from Flavobacterium Meningosepticum was reported to be a
potent candidate for a peptidase therapy for CD because of its post-proline specificity
[1]. In addition, endogenous proteases isolated from germinated seeds [2], were able to
degrade peptide PQPQLPYPQPQLPY, which is the repetitive part of 33-mer.
However, oxidation by reactive oxygen species (ROS) is another mechanism for
protein degradation. Free radical-mediated oxidation often occurs in food and
biological systems. Then, hydroxyl radical (.OH), a very strong ROS, can be formed
through a Fenton-type reaction, where hydrogen peroxide reacts with a reduced
transition metal (e.g. Fe2+, Cu+) [3]. Protein oxidation can cause fragmentation of
polypeptide chains, generation of protein-protein cross-links, and oxidation of amino
acid side chains [4].
Uchida et al. [5-6] and Kato et al. [7] studied metal-catalysed oxidation of prolinecontaining
peptides and collagen. It was reported that oxidation of proline-containing
peptides in a Cu2+/H2O2 system not only caused oxidative modification of proline
residues, but also triggered oxidative cleavage of proline peptide bonds, and the
generation of 2-pyrrolidone compounds. Collagen has a triple helical structure and a
repeated sequence of glycine-X-Y, where X and Y are often proline and
hydroxyproline. Wheat and barley prolamins also contain repeating sequences with
proline residues, and this suggests that breakdown of repeating sequences could occur
in prolamins as well as in collagen.
The aim of our study was to examine the non-enzymatic oxidation of the model 33-
mer peptide under different oxidation conditions. Our hypothesis was that the 33-mer
can be degraded by non-enzymatic oxidation and that oxidative modification of CDactive
epitopes can reduce the toxicity of the 33-mer peptide.
Materials and methods
The reaction solution contained 2 mg/mL 33-mer peptide and 0.05 mmol/L CuSO4 or
FeSO4 in milli-Q water (pH 4.5). The reaction was initiated by adding freshly prepared
50 mmol/L hydrogen peroxide or ascorbic acid. Incubation temperature was 37 °C.
The reaction was terminated by adding 1 mmol/L EDTA.
The reaction mixture was analysed by size-exclusion chromatography (SEC). SEC
columns Superdex Peptide 10/300 GL and Superdex 200 10/300 (GE Healthcare
Biosciences AB, Uppsala, Sweden) were combined in a model 1200 HPLC system. A
competitive ELISA was used for the 33-mer immunological activity test (Ridascreen
Gliadin Competitive R7021, R-Biopharm, Darmstadt, Germany). Dityrosine crosslinks
were characterised by luminescence spectrometer. The measurement was upon
fluorescence excitation at 284 nm, and the intensity was recorded at emission 410 nm
[8]. Protein carbonyl group was measured with the DNPH method described by
Reznick and Packer [9].
Results and discussion
Size distribution changes of the 33-mer peptide after metal-catalysed oxidation were
observed by SEC analysis. The most extensive decrease in size of the 33-mer was
found, when oxidative treatment was given using Fe2+/H2O2 (Fig. 1, oxidation of
Cu2+/H2O2, Fe2+/ascorbic acid, and Cu2+/ascorbic acid not shown). A broad peak was
observed in Fe2+/ H2O2 oxidation of 33-mer peptide, indicating modification of 33-mer
structure. Some small fragments and aggregates were formed. Fe2+/H2O2 oxidation of
the 33-mer was chosen for immunological activity test. The R5 antibody mainly
recognises the epitope QQPFP, but also recognises the epitopes LQPFP and QLPYP.
After 4 h of incubation, the immunological activity against R5 antibody decreased to
40% of its original value, and remained 18% after 24 h of oxidation (Fig. 2).
Production of cross-links through dityrosine linkages was observed in Fe2+/H2O2
oxidation of 33-mer (Fig. 3). With the initiation of the tyrosine radical by hydroxyl
radicales, dityrosine is likely to be formed, resulting in intra- and intermolecular crosslinks.
Hydroxyl radicals can also attack aromatic side chain of phenylalanine, adding a
hydroxyl group to the ring structure. During 4 h of oxidation, carbonyl groups were
readily formed through Fe2+/H2O2 oxidation of the 33-mer. Carbonyl groups formation
from protein oxidation mainly originates from the amino acids proline, lysine,
arginine, and threonine. Side-chain modification of proline residues by hydroxyl
radicals generates glutamate-5-semialdehyde. Considering the amino acid composition
of the 33-mer, the high content of proline residues mostly contributed to the formation
of carbonyl groups.
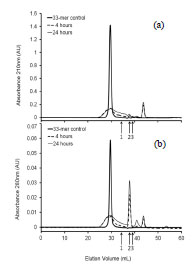
Figure 1. Size-exclusion chromatography of Fe2+/H2O2 oxidation of 33-mer peptide.
(a) Absorbance 210 nm; (b) absorbance 280 nm. Arrows 1, 2 and 3 indicate the
elution volume of molecular markers 1085.2, 356.4 and 146.2 g/mol
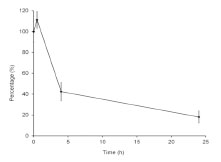
Figure 2. R5 competitive enzyme-linked immunosorbent assay (ELISA) of Fe2+/H2O2-
catalysed 33-mer oxidation. Intact 33-mer control contains 100% activity against R5
antibody. R5 recognition of oxidised 33-mer is shown as percentage of the initial 33-
mer activity. Error bars indicate the standard deviation of four measurements
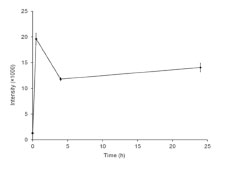
Figure 3. Putative production of dityrosine linkages in Fe2+/H2O2 oxidation of the 33-
mer peptide over time
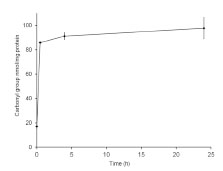
Figure 4. Yields of carbonyl groups in Fe2+/H2O2 oxidation of 33-mer peptide over
time
Conclusion
In our study, we showed that a model 33-mer peptide from prolamin can be modified
by metal-catalysed oxidation. In Fe2+/H2O2-induced oxidation, the immunological
activity of 33-mer peptide decreased to 18% of its initial level after 24 h of oxidation,
when measured by the R5 competitive ELISA test for CD-active epitopes. Carbonyl
groups and dityrosine cross-links were readily formed indicating proline and tyrosine
modification. This also changed the structure of the CD-active epitopes. Oxidation can be further studied in the modification of cereal prolamin proteins, such as wheat
gliadin and barley hordein, to reduce their CD-immunological activities.
References
1. Shan L, Molberg Ø, Parrot I, et al. Structural basis for gluten intolerance in celiac
sprue. Science 2002; 297: 2275-2279.
2. Hartmann G, Koehler P, Wieser H. Rapid degradation of gliadin peptides toxic for
coeliac disease patients by proteases from germinating cereals. J Cereal Sci 2006;
44: 368-371.
3. Davies MJ. The oxidative environment and protein damage. Biochim Biophys Acta
2005; 1703: 93-109.
4. Stadtman ER, Levine RL. Free radical-mediated oxidation of free amino acids and
amino acid residues in proteins. Amino Acids 2003; 25: 207-218.
5. Uchida K, Kato Y, Kawakishi SA. Novel mechanism for oxidative cleavage of
prolyl peptides induced by the hydroxyl radical. Biochem Biophys Res Commun
1990; 169: 265-271.
6. Uchida K, Kato Y, Kawakishi S. Metal-catalyzed oxidative degradation of
collagen. J Agric Food Chem 1992; 40: 9-12.
7. Kato Y, Uchida K, Kawakishi S. Oxidative fragmentation of collagen and prolyl
peptide by Cu(II)/H2O2. Conversion of proline residue to 2-pyrrolidone. J Biol
Chem 1992; 267: 23646-23651.
8. Giulivi C, Traaseth NJ, Davies KJA. Tyrosine oxidation products: Analysis and
biological relevance. Amino Acids 2003; 25: 227-232.
9. Reznick AZ, Packer L. Oxidative damage to proteins: Spectrophotometric method
for carbonyl assay. Methods Enzymol 1994; 233: 357-363.
4.10 Production of gluten-free beer by using malt extract
with high peptidase activity
Verena Knorr, Herbert Wieser, Peter Koehler
Deutsche Forschungsanstalt für Lebensmittelchemie, Leibniz Institut, Freising,
Germany
Introduction
In Germany, about 500,000 people (approximately 100,000 diagnosed and 400,000
silent cases) suffer from coeliac disease (CD), which is associated with damage of the
intestinal mucosa and subsequently leads to malabsorption and deficiency symptoms.
CD is triggered by the ingestion of storage proteins of wheat (gliadins and glutenins),
rye (secalins), and barley (hordeins), which are called gluten in the field of CD [1].
Coeliacs have to adhere to a strict lifelong gluten-free diet. For example, they cannot
drink conventional beer and have to consume surrogates made from gluten-free cereals
or pseudocereals [2]. However, these products do not meet the German beer law
(“Reinheitsgebot”) and mostly differ from barley-based beers in terms of aroma and
taste. It has been known for a long time that gluten is massively degraded by
endogenous peptidases in germinating cereals. Preliminary experiments have shown
that extracts from germinated cereals were able to degrade gluten in malt drink to a
concentration below 20 mg gluten/kg, which is required by the Codex Alimentarius
and European legislation (regulation 41/2009) to justify a gluten-free claim [3]. Thus,
cereal malt and products thereof might be used to detoxify gluten-containing, cerealbased
beverages. Therefore, the aim of this study was the production of malt with
optimised peptidase activity, which should be used for degrading gluten during beer
production to yield a product with a gluten content below 20 mg/kg and quality
parameters comparable to conventional beer.
Materials and methods
First, the conditions during germination of barley (time, temperature, water content of
the grains) were systematically altered by means of Response Surface Methodology
(RSM) to obtain malt with the highest possible peptidase activity as well as good
suitability for brewing. The gluten-specific peptidase activity of aqueous malt extracts
was determined by RP-HPLC using two coeliac-active substrate peptides
(PQPQLPYPQPQLPY; P1 from α-gliadin and SQQQFPQPQQPFPQQP; P2 from γ-
hordein) [4,5] and quantifying the degree of degradation over time. In addition, the
influence of kilning and of temperature on the peptidase activity of the aqueous extract
were examined. Then, an enzyme-active malt extract was prepared by concentrating
the aqueous solution at 50 °C under reduced pressure. The concentrated malt extract
was used for the degradation of the gluten content of wort, and the effects of the pH value, incubation time, temperature, and the extent of concentration of the extract were
studied. Finally, the process was up-scaled and the resulting beer was analysed for its
gluten content (R5 competitive ELISA) and sensory properties.
Results and discussion
The results of the RSM showed that endogenous malt peptidases efficiently degraded
coeliac-active peptides, partly yielding fragments with a length of less than nine amino
acids. The enzyme activity of the malt was significantly increased compared to the raw
material and optimised by altering the germination parameters. High temperatures of
up to 80 °C during kilning only caused a small decrease of the endogenous peptidase
activity of the malt. The aqueous malt extract tolerated temperatures of up to 50 °C
without loss of activity. By removing water under reduced pressure at 50 °C and using
a high water-to-grist ratio, the activity of the malt extract was further increased.
However, concentrating not only increased the peptidase activity but also the gluten
content of the extract. After adding the concentrated extract to cold wort, gluten was
most efficiently degraded at high temperatures and high pH, however, the enzymes
were active for a longer time at low temperatures. During incubation of wort with 10%
malt extract (water-to-grist ratio of 1 : 2.5; 38% Brix) at 50 °C, the gluten content
decreased below 20 mg/kg after 24 h (threshold for gluten-free foods) and below the
limit of quantitation of the ELISA method (10 mg/kg) after 36 h (Fig. 1).
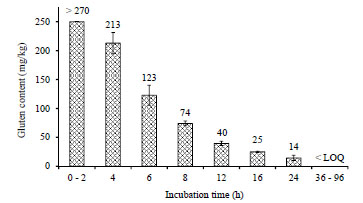
Figure 1. Decrease of the gluten content of wort after addition of malt extract with
high peptidase activity as affected by the incubation time (0 - 96 h). Gluten was
quantitated by means of a competitive R5 ELISA. > 270: Concentration beyond the
working range of the method; < LOQ: Concentration below the limit of quantitation of
the method (10 mg gluten/kg)
Finally, a malt extract (40% Brix, water-to-grist-ratio 1 : 2.5) was prepared and 10%
were added to wort. After an incubation time of 24 h at 50 °C followed by
fermentation, the gluten content of the beer was below 10 mg gluten/kg compared to
86.4 ± 9.0 mg/kg in the control without added malt extract. Sensory evaluation of the
beers according to DLG (Fig. 2) showed that the peptidase-treated beer could not be
distinguished from the reference beer and was more popular than a gluten-free millet
beer. However, the extract-treated beer had a lower foam stability than the reference.
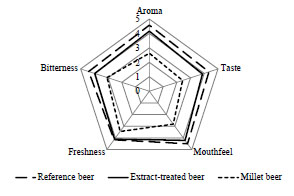
Figure 2. Results of the sensory evaluation of beers. Reference beer was produced
without addition of malt extract; extract-treated beer was produced by adding 10%
concentrated malt extract with high peptidase activity; millet beer was commercially
available. Rating: 0 = unsatisfactory; 5 = no deviation from quality requirements
Conclusions
It is possible to produce gluten-free beer according to the German “Reinheitsgebot”.
Malt with high peptidase activity can be obtained by optimising the germination of
barley grains. Shelf life and peptidase activity can be increased by concentrating an
aqueous extract of the malt. A mixture of concentrated malt extract with high
peptidase activity and conventional wort enables the production of gluten-free beer
with a gluten content below 20 mg/kg. The sensory properties of this gluten-free beer
are comparable to conventionally produced beer.
Acknowledgement
This work was supported by the FEI (Forschungskreis der Ernährungsindustrie e.V.,
Bonn), the AiF and the German Ministry of Economics (Project No. 16971 N).
References
1. Wieser H, Koehler P. The biochemical basis of celiac disease. Cereal Chem 2008;
85: 1-13.
2. Koehler P, Geßendorfer B, Wieser H. Preparation of partially hydrolysed
prolamins as references for the immunochemical quantification of gluten in
cereal-based beverages. In: Stern M (ed): Proceedings of the 23th Meeting of the
Working Group on Prolamin Analysis and Toxicity. Verlag Wissenschaftliche
Scripten, Auerbach, 2009; pp. 35-40.
3. Nic Phiarais BP, Arendt EK. Malting and brewing with gluten-free cereals. In.
Arendt EK, Dal Bello F (eds): Gluten-Free Products and Beverages. Academic
Press, Amsterdam, New York, San Diego, 2008; pp. 347-372.
4. Vader LW, Stepniak DT, Bunnik EM, et al. Characterization of cereal toxicity for
celiac disease patients based on protein homology in grains. Gastroenterology
2003; 125: 1105-1113.
5. Gessendorfer B, Hartmann G, Wieser H, Koehler P. Determination of celiac
disease-specific peptidase activity of germinated cereals. Eur Food Res Technol
2011; 232: 205-209.
5. Clinical research reports
5.1 The prospective multicentre trial of antibody
diagnostics in paediatric coeliac disease (AbCD) -
blinded status report after registration of 437 children
Thomas Mothes1, Johannes Wolf1, David Petroff2, Dirk Hasenclever3
1 Institute for Laboratory Medicine, Clinical Chemistry and Molecular Diagnostics,
Medical Faculty of the University and University Hospital, Leipzig, Germany
2 Clinical Trial Centre, University of Leipzig, Germany
3 Institute for Medical Informatics, Statistics and Epidemiology, University of Leipzig,
Leipzig, Germany
Introduction
The European Society of Paediatric Gastroenterology, Hepatology and Nutrition
(ESPGHAN) recently published new guidelines for the diagnosis of coeliac disease
(CD) [1]. One important question asked in the new guidelines was “In which patients
can the diagnosis of CD be made without duodenal biopsies?” The guidelines
recommend that “in children and adolescents with signs or symptoms suggestive of
CD and very high anti-tTG titres with levels exceeding 10 times the upper limit of
normal (> 10 x ULN) the likelihood for villous atrophy (Marsh 3) is high. In this
situation, the paediatric gastroenterologist may discuss with the parents and patient (as
appropriate for age) the option of performing further laboratory testing (EMA, HLA)
in order to make the diagnosis of CD without biopsies. Antibody positivity should be
verified by EMA from a blood sample drawn at a separate occasion to the initial test in
order to avoid false-positive serology results due to mislabelling of blood samples or
other technical mistakes. If EMA testing confirms specific CD antibody positivity in
this second blood sample, the diagnosis of CD can be made and the child started on a
GFD. It is advisable to check for HLA types in patients diagnosed without small
intestinal biopsy to reinforce the diagnosis of CD.”
The guidelines went on to say that the performance in clinical practice should be
evaluated prospectively. A prospective international multicentre biopsy-controlled trial
on antibody diagnostics in paediatric coeliac disease (AbCD, German Clinical Trial
Register ID: DRKS00003854) [2] was started recently (inclusion of the first
participant October 18, 2012) to evaluate the proposed algorithm to diagnose CD.
Here, we present a status report. Our analysis is blinded, i.e., data on symptoms,
antibodies, and histology are not correlated with diagnoses.
Basic trial flow
The basic flow of the AbCD trial is as follows: After registration of the patient
according to the inclusion criteria (children and adolescents scheduled for duodenal
biopsy as by standard clinical practice with the primary aim to confirm or refute CD),
there are several visits. At the first visit, the reasons for biopsy are documented and, if
there were already prior antibody tests, the results of these tests are recorded.
At the next visit, a blood sample is taken and endoscopy is performed. The results of
the histological assessment of the biopsy at the trial centre are documented. The blood
samples are shipped for assay of antibodies (IgA- and IgG-antibodies against tissue
transglutaminase [aTTG], deamidated gliadin peptides [aDGP], and endomysium
[EMA], as well as total IgA). The antibody assays are performed applying the tests of
EUROIMMUN in Dassow, Germany (without knowledge of histology or of clinical
symptoms). The slides with the tissue sections are sent for blind reference histology to
the Departments of Pathology of the Clinical Centre “Sankt Georg” and of the
University Hospital (Leipzig, Germany). In case of marked differences between the
local (trial centre) and the central pathology, there is a third histological assessement in
the Department of Pathology of the University Hospital Dresden (Germany). There is
feedback to the trial centres within 3 months, before the patient is seen next in the
hospital for follow-up (visit 3).
Visit 3 takes place about 3 months after endoscopy. If the patient is on a gluten-free
diet, another blood sample is taken and analysed. In most cases, a diagnosis can
already be made after 3 months. If the paediatric gastroenterologist is not sure about
the diagnosis at this time, we wait for a fourth visit.
Twelve children’s hospitals (2 from England, 2 from Austria, and 8 from Germany)
participate in the trial (see acknowledgments).
Current status
Four hundred and thirty-seven patients were registered by July 4, 2014. Of them, 376
children already underwent endoscopy. For most of the remaining children, the
documentation was not yet complete. From the patients, who had already had an
endoscopy, 262 children had already finished the trial. Of the remaining children, in
113 cases, the follow-up was still missing. From the regularly finished patients, 180
had CD and 78 had no CD (prevalence 69.8%). In 4 cases, the diagnosis remained
unclear.
Of the 376 patients who already underwent endoscopy, 359 had a prior antibody test
(with test results available already before the start of the AbCD trial). Endoscopy was
performed in 77% of the cases due to the results of these previous antibody tests.
Among these tests, the assay of IgA-aTTG was most often used to select children for
endoscopy. About 60% of patients were selected for biopsy due to positive IgA-aTTG
and more than 70% of patients due to positive IgA-aTTG and / or IgA-EMA tests.
The next two most common causes for endoscopy were abdominal pain (60%) and
diarrhea (31%). The low frequency of children with failure to thrive (17%), weight
loss (13%), and short stature (10%) was striking.
The distribution of antibody data (IgA-aTTG versus IgG-aDGP) is shown in Fig. 1.
The percentage of patients with antibody concentrations in the “grey zone” was 18.3%
for IgA-aTTG and 43.2% for IgG-aDGP. We define the “grey zone” here to be
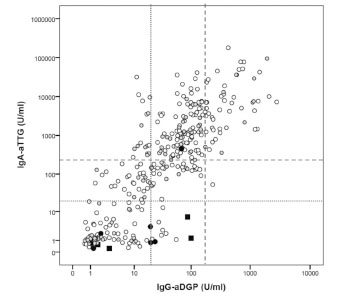
Figure 1. Concentration of IgA-antibodies against tissue transglutaminase (IgAaTTG)
and of IgG-antibodies against deamidated gliadin peptides (IgG-aDGP) from
345 patients included hitherto into the AbCD trial. Open circles: IgA-competent
patients, filled black circles: partial IgA deficiency (IgA < age specific cut-off but > 50
mg/l), filled black squares: selective IgA-deficiency (IgA < 50 mg/l); filled grey
circles: hitherto unknown IgA-status. The dotted lines indicate the company cut-offs
and the dashed lines indicate the 10 x company cut-offs (10 x ULN)
the range between the company cut-off and 10 x ULN. The percentage of patients in
the grey zone was higher than decribed in our recent retrospective trial [3]. Reasons
for that may be different recruiting strategies, higher prevalence or higher number of
unclear cases in the prospective trial. Half of the patients had their follow-up visit after a little bit more than 3 months and more than 90% of the patients within 5 months.
There was a clear tendency for a decrease in antibody concentrations during follow-up.
There were a few children, in whom the antibodies did not decrease, but instead even
increased up to 5- or 6-fold, presumably due to lack of a proper gluten-free diet.
The histology reports were complete from 309 patients. In 13 cases, we found a
marked difference (compatible versus not compatible with CD) between local and
reference histology. Therefore, a second reference histology was necessary. In 10 of
these 13 cases, a marked difference between the estimate of the second and the third
pathologist was found. That is why a final joint evaluation of the second and third
pathologist was performed. In 12 of 309 cases, the differences were relevant for
diagnosis. There were 9 cases, in which the first assessment did not suggest CD, but
the reference histology did. And there were 3 cases, in which first assessment pointed
to CD, but the reference histology did not.
Conclusions
About half of the total number of AbCD patients has already been recruited. In 69% of
patients, the final diagnosis of CD was made. This – at first glance – pretends a high
pre-test probability. However, the main reason for inclusion into the trial was previous
antibody testing. This means a strong preselection of patients by prior IgA-aTTG and
IgA-EMA testing. The high proportion of patients, who have already had an IgAaTTG
or an IgA-EMA test, reflects a current clinical reality. The strong preselection is
a reason for the high prevalence of CD patients. This high prevalence does not reflect a
true pre-test probability (i.e., before measurement of antibodies), which is probably
much lower [4-6]. The diagnostic properties of the tests and diagnostic algorithms
should ideally be robust enough to be reliable even without prior tests.
In the current data, we see less clearly distinct groups of patients with high and low
antibody values than with retrospective patient selection. There were important
differences between local and central histology evaluations. In about 4% of cases, the
differences were relevant for diagnosis. The last patients are expected to be recruited
by the end of 2015.
Acknowledgments
Thanks to the clinical investigators Th. Richter (Children’s Hospital of the Clinical
Centre “Sankt Georg”, Leipzig, Germany), H. Uhlig (Translational Gastroenterology
Unit, Experimental Medicine, University of Oxford, John Radcliffe Hospital, Oxford,
England), M. Auth (Alder Hey Children’s National Health Service Foundation,
Liverpool, England), M. Laaß (University Children’s Hospital, Dresden, Germany),
K.-M. Keller (Department of Paediatrics, Deutsche Klinik für Diagnostik, Wiesbaden,
Germany), N. Händel and G. Flemming (University Children’s Hospital, Leipzig,
Germany), A. Hauer (University Children’s Hospital, Graz, Austria), K.-P. Zimmer
(University Children’s Hospital, Gießen, Germany), F. Schmidt (University Children’s Hospital, Halle, Germany), A. Krahl (Children’s Hospital “Prinzessin Margaret”,
Darmstadt, Germany), M. Heiduk (Department of Paediatrics, Helios Hospital, Plauen,
Germany), W.-D. Huber (University Children’s Hospital, Vienna, Austria), to the
reference pathologists V. Wiechmann (Department of Pathology of the Clinical Centre “Sankt Georg”, Leipzig, Germany), D. Aust (Department of Pathology, University
Hospital, Dresden, Germany), A.-K. Höhn (Department of Pathology, University
Hospital, Leipzig, Germany), and to B. Teegen and A. Jahnke (EUROIMMUN
Medizinische Labordiagnostika AG, Niederlassung Dassow) for antibody assays. This
trial is part of a project funded by the European Regional Development Fund.
References
1. Husby S, Koletzko S, Korponay-Szabo IR, et al. European Society for Pediatric
Gastroenterology, Hepatology, and Nutrition guidelines for the diagnosis of
coeliac disease. J Pediatr Gastroenterol Nutr 2012; 54:136-160.
2. AbCD - Clinical Trial. Available: https://eclinical.imise.uni-leipzig.de/abcd/
3. Wolf J, Hasenclever D, Petroff D, et al. Antibodies in the diagnosis of coeliac
disease: A biopsy-controlled, international, multicentre study of 376 children with
coeliac disease and 695 controls. PLoS ONE 2014; 9: e97853.
doi:10.1371/journal.pone.0097853.
4. Vecsei A, Arenz T, Heilig G, et al. Influence of age and genetic risk on anti-tissue
transglutaminase IgA titers. J Pediatr Gastroenterol Nutr 2009; 48: 544-549.
5. Vermeersch P, Geboes K, Marien G, et al. Defining thresholds of antibody levels
improves diagnosis of celiac disease. Clin Gastroenterol Hepatol 2013; 11: 398-
403.
6. Reeves GEM, Squance ML, Duggan AE, et al. Diagnostic accuracy of coeliac
serological tests: a prospective study. Eur J Gastroenterol Hepatol 2006; 18: 493-
501.
5.2 WIESLAB® Celiac hs Screen: detection of
autoantibodies against coeliac disease-specific
peptide antigens
Norman Händel1, Christian Spranger2, Johannes Wolf3
1 University Children's Hospital, Leipzig, Germany
2 “Sankt Georg” Children’s Hospital Leipzig, Leipzig, Germany
3 Institute for Laboratory Medicine, Molecular Diagnostics and Clinical Chemistry,
University of Leipzig, Leipzig, Germany
Introduction
The current European guidelines [1] estimated the performance of IgG antibody tests
against deamidated gliadin peptides (IgG-DGP) to be inferior to that of IgA anti-tissue
transglutaminase (IgA-tTG) and IgA antibodies against endomysium diagnosing
paediatric coeliac disease (CD). Contrary, the British Society of Gastroenterology
recommended IgG anti-DGP assays in diagnosis of adult CD in their current
guidelines [2]. Conclusive studies on the predictive power of IgG-DGP tests are still
rare. Possibly IgG-DGP assays provide an additional benefit for a reliable diagnosis of
CD.
WIESLAB® Celiac hs Screen test is a novel microplate-based assay for the detection
of IgG-DGP. The synthetic peptide sequences mimic deamidated gluten peptides
recognised by T cells in the initial immune response of CD. More than 70 peptides
were screened for reactivity and the most suitable peptide sequences were selected as
antigens for the test.
Previous studies with WIESLAB® Celiac hs Screen test revealed sensitivities and
specificities of 85 to 87% and 94 to 98% for CD, respectively [data not published].
However, inclusion of CD patients on a gluten-free diet and lacking information on
histology in the control group were strong limitations of the study.
Therefore, we have retrospectively assessed the performance of Celiac hs Screen in a
collection of sera of patients with intestinal disorders or CD-associated diseases [3,4]
and compared the results with data of two commercially available tests (IgA-tTG and
IgG-DGP, Phadia) for diagnosis of CD. We hypothesised that a double positive test
result (IgA-tTG and IgG-DGP) could render biopsies unnecessary for diagnosing CD.
Materials and methods
We analysed the performance and predictive power of the WIESLAB® Celiac hs
Screen test (Euro Diagnostica AB, Malmö, Sweden) performed in sera of 276 children
and adolescents (123 boys and 153 girls, mean age 7.8 years, range 0.8 - 17.9 years).
The serum samples included 69 sera of CD patients and 207 disease controls resulting
in a prevalence of about 25%. The samples were collected consecutively between 2006
and 2012 in Leipzig (University Children’s Hospital Leipzig and “Sankt Georg”
Children’s Hospital Leipzig, Germany).
All patients were biopsied during upper gastrointestinal endoscopy and a detailed
histology report (including information of either number of intraepithelial lymphocytes
or their count with respect to cut-off) was available. Blood samples were taken on a
gluten-containing diet not more than three months before and not later than three
weeks after biopsy. Selective IgA deficiency (sIgAD) was found in two controls and
three CD patients. There were six children with type 1 diabetes mellitus (four CD
patients and two controls). Furthermore, the control group comprised 12 patients with
either Crohn’s disease or ulcerative colitis.
Antibodies were measured (blinded to the diagnosis and histological data) in the lab of
Euro Diagnostica AB in Malmö applying the WIESLAB® Celiac hs Screen test and
two further ELISAs (IgA-TTG and IgG-DGP of Phadia, Uppsala, Schweden),
respectively.
Concerning a single and double test strategy, we assume the diagnosis is reliable, if
positive predictive value (PPV) and negative predictive value (NPV) are
simultaneously at least 95% with a lower limit for the confidence interval (CI95%) of
90%. PPV and NPV were calculated depending on prevalence (10% and 50%,
respectively) using Bayes’ formula. A maximum prevalence of 10% is assumed as pretest
probability of patients without any prior antibody test [5].
Receiver Operating Characteristic (ROC) analyses were performed with SPSS 20.
Results and discussion
The IgA-tTG test had the best combination of sensitivity and specificity (highest
accuracy) as well as of PPV10% and NPV50% (Tab. 1). However, the sensitivity was
lower in comparison to that of the WIESLAB® Celiac hs Screen (0.91 to 0.94). The
WIESLAB® Celiac hs Screen test possessed also the highest NPV50% but the lowest
specificity and PPV10%.The Phadia test for IgG-DGP showed intermediate results but
also a low PPV10% of only 0.54.
We believe that there are several reasons for the low specificity of the WIESLAB® Celiac hs Screen test. The main reason seems to be the choice of a low cut-off (> 3
U/mL). Therefore, we performed a ROC analysis. The analysis (AUC = 0.962)
disclosed that a cut-off of > 5 U/mL would increase the accuracy. Applying this higher
cut-off would not significantly influence sensitivity and NPV but would improve
specificity and PPV markedly (Tab.1).
The most prominent feature of the WIESLAB® Celiac hs Screen is its high sensitivity
also at a cut-off of 5 U/mL. Hence, the question arises if this test is able to pick up CD
patients, who are negative for IgA-tTG. In total, six CD patients were not recognised by the IgA-tTG test but three of them were positive for WIESLAB® Celiac hs Screen
(Tab. 2).
Table 1. Performance and predictive power of WIESLAB® Celiac hs Screen at
different cut-offs in comparison to two often used CD-specific antibody tests.
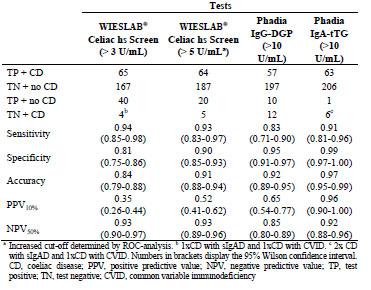
One has a selective sIgAD. Interestingly, we found two further CD patients, which
were IgA competent but with a negative result of IgA-tTG. It should be mentioned that
these patients would be detected similarly by the IgG-DGP assay of Phadia (Tab. 2).
In our opinion, these IgA-tTG-negative CD patients are often underrepresented or not
mentioned in most studies due to the pre-selection by IgA-tTG assays. Moreover, these
patients would have been overlooked by the ESPGHAN guidelines, which recommend
omitting assays based on the detection of IgG-DGP. According to several studies, the
proportion of IgA-tTG-negative CD patients may be as high as 8% [6] or even 24%
[7].
Is it possible to diagnose or exclude CD without confirmatory endoscopy? For that, the
ESPGHAN recommended to apply the tenfold cut-off of the upper limit (10xULN) for
the IgA-tTG test, and confirmatory testing by IgA-EMA and HLA-typing [1].
Table 2. CD patients with a negative IgA-tTG result.
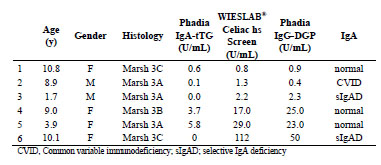
Different from the ESPGHAN guidelines, we hypothesise that, when combining IgAtTG
and WIESLAB® Celiac hs Screen, the reliable criteria concerning PPV and NPV
for a diagnosis without biopsy are fulfilled (Tab. 3). This is true for both the low and
the high cut-off of WIESLAB® Celiac hs Screen. Using the low cut-off of only 3
U/mL, the number of needless biopsies would be almost be doubled. Therefore, the
higher threshold value should be used. Using a combination of the two Phadia tests,
the results are comparable (Tab. 3).
To the best of our knowledge, there are currently only two reports on a two-test
procedure for diagnosis and exclusion of CD without endoscopy. Bürgin-Wolff et al.
[8] calculated a PPV and NPV of 0.96 and 0.98, respectively, but regarded a two-test
strategy as unsuitable due to a high number of false-positives (5 of 119 controls).
Instead, the authors recommended a three- or four-test strategy with predictive values
up to 1.00. Unfortunately, the authors did not report the influence of prevalence and
did not calculate confidence intervals.
A second retrospective study [5] of more than 1000 children and adolescents
(including 376 CD patients) revealed that, if combining IgA-tTG and IgG-DGP, a
double negative result reliably excludes CD and a double positive result reliably
confirms the diagnosis of CD up to a prevalence of 17%. A low prevalence (≤ 10%)
has to be assumed, if patients are selected without any prior antibody test. However, at
specialised gastroenterologists´ practices (with prior positive antibody test), higher
prevalences have to be considered.
Conclusions
The WIESLAB® Celiac hs Screen test at company cut-off possesses high sensitivity
but low specificity. At higher cut-off (5 U/mL), the specificity increases without
significant loss in sensitivity. A combination of the WIESLAB® Celiac hs Screen with
the IgA-tTG assay (two-test strategy) results in high PPV and high NPV at prevalences < 10% and > 50%, respectively. Hence, the two-test strategy could render biopsies unnecessary for diagnosis in a large part of CD patients. The retrospective nature, the
size of study population, and the strategy of patient selection (on the basis of prior
IgA-tTG testing) do not allow a final assessment. Therefore, the analysis should be
validated in a further large prospective trial.
Table 3. Two-test strategy for obtaining reliable test results to avoid biopsies.
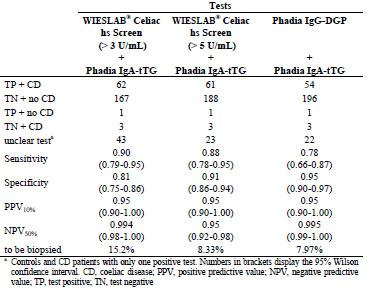
Acknowledgment
Thomas Mothes (Institute for Laboratory Medicine, Molecular Diagnostics and
Clinical Chemistry, University of Leipzig, Leipzig, Germany) and Sten Gershagen
(Euro Diagnostica AB, Malmö, Sweden) provided critical intellectual input.
References
1. Husby S, Koletzko S, Korponay-Szabó I, et al. European Society for Pediatric
Gastroenterology, Hepatology, and Nutrition Guidelines for the Diagnosis of
Coeliac Disease. J Pediatr Gastroenterol Nutr 2012; 54: 136-160.
2. Ludvigsson JF, Bai JC, Biagi F, et al. Diagnosis and management of adult coeliac
disease: guidelines from the British Society of Gastroenterology. Gut 2014; 63:
1210-1228.
3. Prause C, Ritter M, Probst C, et al. Antibodies against deamidated gliadin as new
and accurate biomarkers of childhood coeliac disease. J Pediatr Gastroenterol
Nutr 2009; 49: 52-58.
4. Wolf J, Hasenclever D, Petroff D, et al. Antibodies in the Diagnosis of Coelia
Disease: A Biopsy-Controlled, International, Multicentre Study of 376 Children
with Coeliac Disease and 695 Controls. PLoS ONE 2014; 9: e97853.
5. Reeves GEM, Squance ML, Duggan AE, et al. Diagnostic accuracy of coeliac
serological tests: a prospective study. Eur J Gastroenterol Hepatol 2006; 18: 493-
501.
6. Hopper AD, Cross SS, Hurlstone DP, et al. Pre-endoscopy serological testing for
coeliac disease: evaluation of a clinical decision tool. BMJ 2007; 334: 729.
7. Dahle C, Hagman A, Ignatova S, et al. Antibodies against deamidated gliadin
peptides identify adult coeliac disease patients negative for antibodies against
endomysium and tissue transglutaminase. Aliment Pharmacol Ther 2010; 32:254-
260.
8. Bürgin-Wolff A, Mauro B, Faruk H. Intestinal biopsy is not always required to
diagnose celiac disease: a retrospective analysis of combined antibody tests. BMC
Gastroenterol 2013; 13: 19.
5.3 Intraluminal p31-43 gliadin peptide induces
enteropathy
Romina Araya1, Jennifer Jury2, Elena F. Verdu2, Fernando Chirdo1
1 Instituto de Estudios Inmunológicos y Fisiopatológicos (IIFP-CONICET/UNLP),
Buenos Aires, Argentina
2 Farncombe Institute, McMaster University, Hamilton, Canada
Introduction
Coeliac disease (CD) pathogenesis depends on the activation of gluten specific Th1
cells in susceptible individuals, who carry the HLA-DQ2 and/or HLA-DQ8
predisposing alleles [1,2]. The mechanisms, involved in the exacerbated expansion of
Th1 cells, have been largely characterized during the last decades. Most of our
knowledge of CD pathogenesis was based on the evaluation of small pieces of
duodenal biopsies, which account for chronic lesions. Consequently, the initial steps of
the mucosal damage are poorly understood [3].
Animal models are very useful tools to evaluate different steps in disease mechanisms
and test new therapeutic strategies. Different complex models using genetically
modified mice have been reported to assess CD pathogenesis [4]. The usefulness of
different proposed animal models resides in mimicking certain steps of disease
pathogenesis. Most studies focused on the analysis of the chronic phase of the disease,
but few have evaluated the initial steps leading to mucosal damage or the precipitating
factors of the disease.
Epidemiological studies support the association of enteric infections with the
subsequent development of inflammatory or functional gastrointestinal disease [5,6]. Viral infections, in particular enterovirus such as rotavirus, have been suggested to
increase the incidence of CD [7,8]. Case reports have also suggested the association of
enteric infections with CD onset [9]. Currently, the underlying mechanisms that
support this association are poorly understood. However, it is well known that innate
immune activation generates a rapid and strong anti-viral response, which essentially
involves the production of Type I IFNs and other components of the inflammatory
response. The link among enterovirus infection and CD raises the hypothesis that Type
I IFNs may be involved in loss of tolerance to gluten through the ability to promote
inflammation and a strong Th1 response [10].
Poly I:C, a synthetic ligand, reproduces the innate effects of dsRNA and it is used to
mimic viral infections. Previous studies have proposed that intraperitoneal poly I:C
induces enteropathy. These models used parenteral poly I:C administration and
mucosal damage seemed to be specific for TLR3 activation [11-13]. The underlying
mechanisms proposed for intestinal damage include NK cells [14] and CD8αα+ IELs with critical participation of IL-15 [11,12]. A recent study, however, has proposed that
neither NK cells, IELs or IL-15 are involved in the induction of intestinal pathology
[13]. Even when enteropathy was clear, none of the studies evaluated the effect of poly
I:C directly injected in the lumen. Understanding the early and delayed consequences
of immune activation by enteric viral infections or dsRNA, has important implications
for post-infectious inflammatory and functional consequences [6]. To assess the local
effects of different stimuli present in the intestinal lumen, we have recently developed
an animal model based on the intraluminal administration of poly I:C [15]. This model
showed that transient mucosal damage has physiological consequences after
subsequent gluten challenge.
Aim
The aim of our study was to develop a murine model of enteropathy based on the
intraluminal administration of gliadin peptide p31-43 and to evaluate the mechanism
associated to mucosal damage.
Materials and methods
Six to eight-week-old C57BL/6 mice were intraluminaly treated with Poly I:C (4),
p31-43 (5) or PBS (5) and sacrificed after 12 h. In some experiments, we used a nonrelated
peptide (NRP) derived from human thyroid peroxidase (TPO). Small intestinal
samples were collected and fixed with formalin. Paraffin-embedded sections (5 μm)
were obtained, re-hydrated and stained with H&E for further morphometric analysis.
Sections were processed for immunofluorescence microscopy studies, using anti-Ki67
antibody (Novus Biologicals) and the proper secondary antibody (Invitrogen), to
evaluate cell proliferation in crypts. Furthermore, the In Situ Cell Death Detection Kit
(Roche) was used to evaluate cellular death in the small intestine from p31-43 or PBStreated
mice. For the statistical analysis, an unpaired t-test was performed.
Results and discussion
Development of a murine model of enteropathy by intraluminal administration of
poly I:C
We developed a model of enteropathy based on the intraluminal injection of poly I:C,
a synthetic ligand of TLR3, as well as two cytoplasmic receptors, RIG-I and MDA5, in
wild-type mice (C57BL/6).
Briefly, the intraluminal administration of poly I:C to C57BL/6 mice produced severe
enteropathy. At 12 h post poly I:C, we observed shortening and widening of villi,
edema, and increased cell infiltration in the lamina propria (LP). Using H&E staining,
edema, dilated capillaries, and interstitial spaces were observed in intestinal villi. The
evaluation of the villous height/crypt depth ratio (V/C), the most used parameter to
assess histological changes at the small intestinal mucosa, showed a statistically
significant reduction of V/C ratio in poly I:C treated mice compared to those receiving PBS. Furthermore, the number of IELs was increased after poly I:C treatment (Fig. 1).
At 72 h post poly I:C treatment, a partial recovery of V/C ratio was observed, while
the number of IELs remained still altered (not shown). As expected, the surgical
procedure altered intestinal histology. However, this change was transient and control
mice exhibited a faster recovery after treatment.
We performed additional studies to validate this model of enteropathy [15], which
allows the assessment of the mechanisms locally induced in the proximal small
intestine by luminal stimuli, as it is the case for viral infections or dietary antigens.
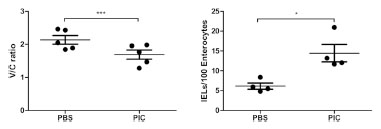
Figure 1. Model of small intestinal enteropathy based on intraluminal administration
of Poly I:C. Evaluation of histological parameters in poly I:C- and PBS-treated
C57Bl/6 mice. V/C ratio and IELs counting were determined 12 h post poly I:C or
PBS treatment. Stats: Unpaired t-test, *p<0.05, ***p<0.001
Intraluminal administration of p31-43 peptide induces enteropathy
Based on the model described above, we tested whether the p31-43 gliadin peptide
triggers mucosal damage when injected at the lumen of the proximal small intestine of
wild-type mice.
As controls, we used C57BL/6 mice treated with PBS as control for the surgical
procedure, as well as a peptide with an unrelated sequence (NRP) to rule out
unspecific effects of a peptide fragment inoculated in the lumen.
The assessment of histological parameters showed that p31-43 induced a severe
enteropathy. The V/C ratio was reduced, while the number of IELs was increased in
p31-43-treated mice (Fig. 2). At 12 h post p31-43 treatment, we observed shortening
and widening of villi, increased cell infiltration in the lamina propria (LP), and edema
indicated by an increase of interstitial space in villous tips (not shown). On the other
hand, PBS and NRP, did not present any histological impairment. At 72 h post p31-43,
there was a partial recovery of V/C ratio and IELs counting, but both parameters
remained statistically significantly altered compared with PBS or NRP-treated mice
(not shown). As it was described previously, the surgical procedure altered intestinal histology [15]. However, this change was transient and PBS and NRP control mice
presented a faster recovery after treatment.
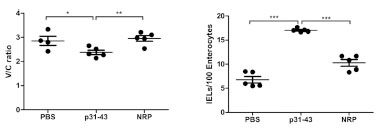
Figure 2. p31-43 induces enteropathy. Evaluation of histological parameters in p31-
43, PBS- and NRP-treated C57BL/6 mice. V/C ratio and IELs counting were
determined after 12 h after intraluminal injection of p31-43, NRP or PBS. Stats:
Unpaired t-test, *p<0.05, ***p<0.001
p31-43 induces cellular death and cell crypt proliferation
Small intestinal damage is normally accompanied by increased cell death and in
parallel, a regenerating process that involves crypt hypertrophy. Since we were
interested in evaluating mechanisms of mucosal damage involved in this enteropathy
model, we assessed cell death and proliferation.
When we evaluated cellular death by the TUNEL technique in small intestinal sections
from p31-43- and PBS-treated mice 12 h post-treatment, a strong increase of the
number of TUNEL+ cells mainly in the lamina propria of p31-43-treated mice was
observed in comparison with PBS-control mice (Fig. 3A). Furthermore, TUNEL+ cells
were also observed in the epithelial layer of the small intestine of p31-43-treated mice,
which were not observed in control mice (not shown). Statistically significant
differences were observed, when the number of TUNEL+ cells was automatically
determined in p31-43- and PBS-treated mice (Fig. 3A).
Next, we assessed the proliferative response in the intestinal mucosa induced by p31-
43. To this end, we used the Ki67 marker, which is a nuclear protein associated with
cellular proliferation. The number of Ki67+ cells was determined in the crypts 12 h
post-treatment. Intraluminal administration of p31-43 induced a strong proliferative
response in the crypts (Fig. 3B).

Figure 3. p31-43 induces crypt proliferation and cellular death in the small intestine.
Cell death (TUNEL+ cells) and proliferative response (Ki67+ cells) were evaluated in
intestinal sections of C57BL/6 mice 12 h after intraluminal administration of p31-43
or PBS. Unpaired t-test, **p<0.01
Altogether, these results show that p31-43 treatment produced a significant increase of
cell death in the lamina propria and in the enterocytes with a strong proliferative
response in the crypts.
Conclusions
In this study, we show the development of a murine model of enteropathy in wild-type
mice based on the intraluminal administration of p31-43. This is the first model
describing the in vivo effects of p31-43 in wild-type mice, which reproduces some of
the features found in active CD.
This work highlights the relevance of an early induction of innate immunity
mechanisms by p31-43. Further investigations should be done to dissect the signalling
pathways implied in p31-43-mediated damage in vivo.
References
1. Sollid LM, Thorsby E. HLA susceptibility genes in celiac disease: genetic
mapping and role in pathogenesis. Gastroenterology 1994; 106: 1133.
2. Abadie V., Sollid LM, Barreiro LB, et al. Integration of genetic and
immunological insights into a model of celiac disease pathogenesis. Annu Rev
Immunol 2011; 29: 493-525.
3. Meresse B., Malamut G., Cerf-Bensussan N., Celiac disease: an immunological
jigsaw. Immunity 2012; 36: 907-919.
4. Marietta EV, Murray J. Animal models to study gluten sensitivity. Semin
Immunopathol 2012; 34: 497-511.
5. Marshall JK, Thabane M, Borgaonkar MR, el al. Postinfectious irritable bowel
syndrome after a food-borne outbreak of acute gastroenteritis attributed to a viral
pathogen. Clin Gastroenterol Hepatol 2007; 5: 457-460.
6. Verdu EF. Editorial: Differences in intestinal microbial composition in children
with IBS-What does it all mean? Am J Gastroenterol 2012; 107: 1752-1754.
7. Stene LC, Honeyman MC, Hoffenberg EJ, et al. Rotavirus infection frequency and
risk of celiac disease autoimmunity in early childhood: A longitudinal study. Am J
Gastroenterol 2006; 101: 2333-2340.
8. Troncone R, Auricchio S. Rotavirus and celiac disease: Clues to the pathogenesis
and perspectives on prevention. J Pediatr Gastroenterol Nutr 2007; 44: 527-528.
9. Verdu EF, Mauro M, Bourgeois J, et al. Clinical onset of celiac disease after an
episode of Campylobacter jejuni enteritis. Canada J Gastroenterol 2007; 21: 453-
455.
10. Sollid LM, Jabri B. Triggers and drivers of autoimmunity: lessons from coeliac
disease. Nat Rev Immunol 2013; 13: 294-302.
11. Zhou R, Wei H, Sun R, et al. NKG2D recognition mediates Toll-like receptor 3
signaling-induced breakdown of epithelial homeostasis in the small intestines of
mice. Proc Natl Acad Sci U S A 2007; 104: 7512-7515.
12. Zhou R, Wei H, Sun R, et al. Recognition of double-stranded RNA by TLR3
induces severe small intestinal injury in mice. J Immunol 2007; 178: 4548-4556.
13. McAllister CS, Lakhdari O, Pineton de Chambrun G, et al. TLR3, TRIF, and
Caspase 8 determine double-stranded RNA-induced epithelial cell death and
survival in vivo. J Immunol 2013; 190: 418-427.
14. Garside P, Felstein M V, Green EA, et al. The role of interferon alpha/beta in the
induction of intestinal pathology in mice. Immunol 1991; 74: 279-283.
15. Araya RE, Jury J, Bondar C, et al. Intraluminal administration of Poly I:C causes
an enteropathy that is exacerbated by administration of oral dietary antigen. PLoS
One 2014; 9: e99236.
5.4 T lymphocytes also react with tissue transglutaminase
Ross Comerford1,2,3, Christian Coates1,2, Greg Byrne1,2, Jacinta Kelly1,2,3, Conleth
Feighery1,2
1 Department of Immunology, St James’s Hospital, Dublin 8, Ireland
2 Institute of Molecular Medicine, Trinity College Dublin, Dublin 8, Ireland
3 National Children’s Research Centre, Our Lady’s Hospital For Sick Children,
Crumlin, Dublin 12, Ireland
Introduction
The principal autoantigen of coeliac disease (CD) is the ubiquitously expressed,
multifunctional enzyme tissue transglutaminase (tTG) [1]. The demonstration of IgA
autoantibodies directed to this self-protein is an integral component in the diagnosis of
CD [2]. tTG is also intimately involved in CD pathogenesis through the modification
of gluten peptides by deamidation, which facilitates their presentation to the immune
system via HLA-DQ2 or DQ8 molecules [3,4].
In addition to their reactivity with gliadin peptides, gliadin-specific T cells have been
speculated to provide T-cell help to tTG-specific B cells, resulting in the anti-tTG
response characteristic of CD. This ‘hapten-carrier’ theory, proposed by Sollid, was
based upon the fact that T cells specific for tTG had never been isolated, and the
gliadin-dependent nature of the anti-tTG response [5]. Preliminary findings from our
group indicated that T cells specific for tTG could be detected in CD patients and in
some control individuals, in a HLA-DQ and HLA-DR restricted manner [6]. The
existence of tTG-specific T cells was further confirmed in a recent paper by
Ciccocioppo et al., who described the presence of T cells, mostly CD4 positive, that
proliferated to tTG in a HLA-DQ2-restricted manner [7].
The aim of this study was to further investigate the presence of tTG-specific T cells in
the periphery of CD patients and healthy controls. Such a finding is in keeping with
reports that T cells specific for other autoantigens have been detected in healthy
subjects [8,9]. Peripheral blood samples were challenged with tTG and proliferative
responses measured. tTG-reactive T-cell lines were generated from responsive
individuals and both the intracellular and secreted cytokines IFN-γ, IL-10, IL-17A, and
IL-21 were measured, in tandem with the measurement of proliferation of these cells.
Materials and methods
Study subjects
CD patients and controls were recruited from the Departments of Gastroenterology and
Immunology, St James's Hospital Dublin. Patients with CD were subdivided according to their treatment status and included 33 patients with untreated CD, 65 patients with
treated CD and 54 healthy control subjects.
Proliferation studies
The proliferation of fresh peripheral mononuclear cells (PBMC) was investigated in
the following manner. Cells were separated by density gradient centrifugation and
cultured in RPMI medium with 5% autologous serum in a round-bottomed 96-well
microtitre plate. Wells containing medium and cells only were added in order to
measure background proliferation, and used to calculate the stimulation index (SI)
based on 3H-thymidine incorporation. The tTG antigens used were guinea pig tTG (gp
tTG, Sigma), erythrocyte tTG (tTGery, Inova Diagnostics), and recombinant human
tTG (rh tTG, produced in SF9 insect cells, Zedira), at a concentration of 10 μg/mL. In
some further experiments, a further recombinant tTG product was employed [10].
Cells were cultured for 6 days and for the last 18 h of culture 0.5 μCi of 3H-thymidine
(PerkinElmer) was added. The stimulation index (SI) was calculated by dividing the
mean of the three cpm values for each antigen by that of the unstimulated wells, with
an SI of 2 or greater being considered positive. In experiments measuring the
proliferation of tTG-sensitised T-cell lines, the incubation time was shortened to 72 h.
MHC restriction was investigated using PBMCs from 16 of the CD patients and two
normal controls. PBMCs were cultured with gp tTG in the presence or absence of (i) a γ2A anti-HLA-DR (L243, Becton and Dickinson); (ii) a γ2A non-specific isotype
matched control antibody (Becton and Dickinson); (iii) a γ1 anti-HLA-DQ (SPV-L3, a
gift from Dr. Hergen Spits, University of Amsterdam, Amsterdam, The Netherlands),
or (iv) a γ1 non-specific isotype matched control antibody (Becton and Dickinson).
Proliferation was measured as described above and results were calculated on the basis
of percentage inhibition.
T-cell line generation
For the generation of tTG-specific T-cell lines, 1x10⁶ PBMCs from CD patients or
control individuals in RPMI medium were incubated with tTGery at 10 μg/mL. After 5
days in culture, 20 IU/mL of recombinant human IL-2 (Sigma) was added to each well.
The cells were then cultured for a further 7 days, receiving 20 IU/mL IL-2 on day 9. In
order to expand the T-cell lines, further stimulation with tTGery was performed on days
14 and 28 of culture, using irradiated autologous PBMCs as antigen-presenting cells.
These cell suspensions were then returned to culture for a further 72 h, with
proliferation then measured by 3H-thymidine incorporation. Cellular phenotype (CD4
or CD8 positivity) as well as intracellular cytokine production was determined by flow
cytometric analysis. Cultures for intracellular cytokine staining had 10 ng/mL phorbol
12-myristate 13-acetate (Sigma), 1 μg/mL ionomycin (Sigma), and 10 μg/mL
Brefeldin A (Sigma) added for the final 10 h of culture.
Flow cytometry
Intracellular cytokine production and the phenotype of samples of T cells from each Tcell
line in response to re-stimulation with tTG was assessed. The panel of antibodies
used was CD3-APC-efluor780, CD4-APC, CD8-PECy5, and IFN-γ-FITC
(eBioscience, San Diego, CA). Cells were gated on forward/side scatter, CD3, and
aqua fluorescent reactive dye (Invitrogen) exclusion, which permitted the measurement
of live cells only. Quadrants for all parameters were set using fluorescence minus one
(FMO) controls. For all flow cytometric analysis, 5x10⁵ cells from each sample were
measured.
Measurement of cytokines by ELISA
The supernatants, removed weekly from each T-cell line and media-only controls,
were analysed for the presence of IFN-γ, IL-10, IL-4, IL-17A, and IL-21 using ELISA
MAX™ kits (BioLegend, San Diego, CA).
Statistical analysis
Differences in proliferation in response to tTG between patient and control groups
were evaluated for statistical significance using the Mann-Whitney test, with the paired
t-test used to identify significant effects of MHC blocking on proliferative responses to
tTG. The level of significance was set at 0.05.
Results and discussion
Lymphocyte proliferation assays
Positive proliferative responses to four different sources of tTG, including two
recombinant proteins, were observed not only in patients with CD but also in some
healthy control subjects (Fig. 1). Responses to gp tTG were observed in 80% of
untreated coeliac patients, compared to 40% of treated coeliac patients and 38% of
control subjects (Fig. 1a). Furthermore, the overall SI response of the untreated CD
patients was significantly higher than both the treated CD patients (p = 0.0042, Mann-
Whitney test) and the normal control subjects (p=0.0063, Mann-Whitney test). For the
tTGery antigen, lymphocyte proliferation was again more frequently detected in
untreated CD patients (45%), with 35% of treated CD patients and 24% of controls
responding (Fig. 1b). A similar pattern of response to the recombinant human tTG
preparation (rh tTG) was noted, with positivity detected in the majority of untreated
CD patients (Fig. 1c). Although the level of proliferation was low in the majority of
subjects, these findings strongly suggest the presence of T cells in the circulation,
which specifically react with tTG.
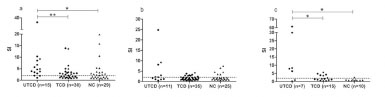
Figure 1. Proliferative responses to guinea pig, erythrocyte, and recombinant human
tTG. Proliferation of PBMCs from normal controls (NC), untreated CD patients
(UTCD), and treated CD patients (TCD) to guinea pig (a), erythrocyte (b), and
recombinant (c) human tTG
MHC blocking studies
In MHC blocking studies, the inhibitory effect of added monoclonal anti-HLA-DR or
anti-HLA-DQ to gp tTG-stimulated PBMC was investigated in 18 individuals (16 CD
and 2 normal control subjects) with known proliferative responses to this antigen. Both
anti-MHC II antibodies caused marked inhibition of proliferation and this was
particularly so with the anti-HLA-DR antibody (results not shown). This finding is also
good evidence that antigen-presenting cells, employing MHC class II molecules, were
involved in the tTG activation of T cells.
T-cell line generation
Three polyclonal T-cell lines were generated by initial stimulation of PBMC with
tTGery and fortnightly re-stimulation of the cell line thereafter (Fig. 2a). The T-cell line
CD01 was generated from a male of 51 years, who had biopsy-confirmed CD, and was
on a strict gluten-free diet for ten years, as evidenced by serial tTG/EMA negativity.
The T-cell lines CT01 and CT02 were generated from two non-CD controls, males of
32 and 56 years, respectively. All three individuals were selected, because they gave a
positive proliferative response to tTGery in 3H-thymidine incorporation assays. The Tcell
lines established were predominantly CD4 positive, the percentage of which
increased over the duration of the culture period for CD01 and CT01 (Fig. 2b).
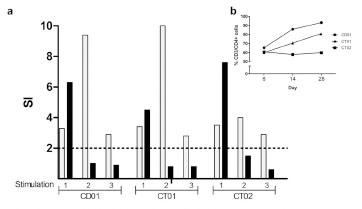
Figure 2. The proliferative responses and phenotype of cells from each T cell line per
round of stimulation. (a) The proliferation of samples of cells from each T cell line in
response to erythrocyte tTG (grey), and PPD (black) was measured by 3H Thymidine
incorporation. Stimulations 1, 2, and 3 represent days 6, 14, and 28 of culture. (SI=
stimulation index, the dashed line indicates the cut-off for positivity). (b) Shows the
percentage of CD4+ T cells contained in each cell line at days 6, 14, and 28 of culture
In order to confirm the antigen specificity of the T-cell lines, re-stimulation with tTGery
was performed, with responsiveness measured by 3H-thymidine incorporation. At each
re-stimulation (days 14 and 28), a proliferative response to tTGery was detected, with
the strongest response being the second stimulation for each cell line. Although the cell
lines had been established using tTGery, after the first stimulation samples of cells from
each cell line had the ability to proliferate in response to the SF9 insect cell-derived rh
tTG antigen at levels equivalent to tTGery.
Intracellular IFN-γ production by T cells from the tTG-specific T-cell lines
Intracellular IFN-γ production in response to stimulation with tTGery was a feature of
the three T-cell lines (Fig. 3a). The strongest increase of CD3/IFNγ+ cells in response
to tTG exposure was seen at stimulation 2 (day 14) for each of the T-cell lines. Similar
levels of cytokines were produced, when rh tTG was substituted for tTGery (Fig. 3b).
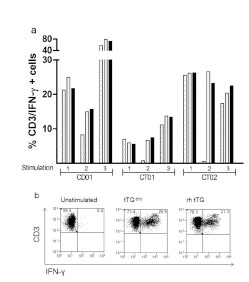
Figure 3. Intracellular IFN-γ production by tTG-specific T cells. The production of
IFN-γ by T cells from each cell line was measured by intracellular cytokine staining
(a). Grey bars = erythrocyte tTG, black bars recombinant human tTG. Background
levels (dotted white bars) were calculated using unstimulated PBMCs (stimulation 1),
or cells from each cell line and feeder cells only (stimulations 2 and 3). Stimulations 1,
2, and 3 represent days 6, 14, and 28 of culture. The data generated from such a
typical experiment is shown in (b), which details stimulation 2 of the CT02 T-cell line
Cytokine secretion by tTG-specific T-cell lines
ELISA measurement of secreted cytokines revealed that IFN-γ was the dominant
cytokine secreted by each T-cell line, with the highest levels detected in the culture
supernatants of the CD01, the treated CD patient-derived cell line (Fig. 4a). This
reached a peak in the week following the first re-stimulation with tTGery. In this cell
line, IL-10 secretion was detected in the first two weeks of culture only, with IL-17A
and IL-21 secretion observed throughout the culture period.
The first control-derived T-cell line, CT01, produced lower levels of IFN-γ and high
levels of IL-10 and IL-17A, all of which reached a maximal level following the first
re-stimulation of the cell line with tTGery (Fig. 4a,b,c). The second control-derived Tcell
line, CT02, produced moderately large amounts of IFN-γ, IL-10, and high levels of
IL-21, all of which peaked after the first re-stimulation with tTGery (Fig. 4a,b,d); this cell line produced no IL-17A (Fig. 4c). No IL-4 was detected in the culture media of
any of the three tTG-specific T-cell lines (data not shown).
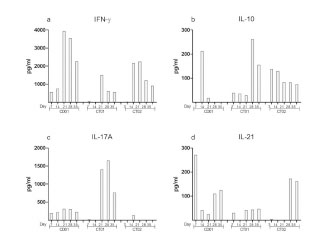
Figure 4. Cytokine secretion by the tTG-specific T-cell lines. Samples of each culture
supernatant were removed weekly and analysed for the presence of secreted cytokines
by ELISA. On days 14 and 28, supernatants were removed prior to the re-stimulation
of each cell line
Conclusions
This study describes the isolation of tTG-specific T cells from the peripheral blood of
treated CD patients and in some normal control subjects. This finding is in keeping
with many publications demonstrating the presence of autoantigen-reactive T cells
responding to a range of self-antigens. When these T cells were maintained in
longterm culture, a range of cytokines were produced with IFN-γ being particularly
prominent. Although not yet explored, it is conceivable that tTG-reactive T cells play a
role in the pathogenesis of the coeliac lesion.
Acknowledgements
This research was funded by the Children’s Medical Research Foundation, Dublin,
Ireland. The authors acknowledge the kind gifts of erythrocyte transglutaminase from
Walter Binder, Innova Diagnostics, San Diego, California, and the monoclonal
antibody SPV-L3 from Dr. Hergen Spits, University of Amsterdam.
References
1. Dieterich W, Ehnis T, Bauer M, et al. Identification of tissue transglutaminase as
the autoantigen of celiac disease. Nat Med 1997; 3(7): 797-801.
2. Di Sabatino A, Corazza GR, Coeliac disease. Lancet 2009, 373(9673): 1480-93.
3. Molberg O, McAdam SN, Korner R, et al. Tissue transglutaminase selectively
modifies gliadin peptides that are recognized by gut-derived T cells in celiac
disease. Nat Med 1998; 4(6): 713-7.
4. Van de Wal Y, Kooy Y, van Veelen P, et al. Selective deamidation by tissue
transglutaminase strongly enhances gliadin-specific T cell reactivity. J Immunol
1998; 161(4): 1585-8.
5. Sollid LM, Molberg O, McAdam S, et al. Autoantibodies in coeliac disease: tissue
transglutaminase - guilt by association? Gut 1997; 41(6): 851-2.
6. Coates C, O'Brien C, Mills K, et al. Proceedings of the Eleventh International,
Symposium on Coeliac Disease. April 28-30, 2004 Belfast, Northern Ireland, 2004;
197.
7. Ciccocioppo R, Finamore A, Mengheri E, et al. Isolation and characterization of
circulating tissue transglutaminase-specific T cells in coeliac disease. Int J
Immunopathol Pharmacol 2010; 23(1): 179-91.
8. Hawkes CJ, Schloot NC, Marks J, et al. T-cell lines reactive to an
immunodominant epitope of the tyrosine phosphatase-like autoantigen IA-2 in
type 1 diabetes. Diabetes 2000; 49(3): 356-66.
9. Pender MP, Csurhes PA, Houghten RA, et al. A study of human T-cell lines
generated from multiple sclerosis patients and controls by stimulation with
peptides of myelin basic protein. J Neuroimmunol 1996; 70(1): 65-74.
10. Comerford R, Byrne G, Feighery C, et al. Binding of autoantibodies to the core
region of tissue transglutaminase is a feature of paediatric coeliac disease. J
Pediatr Gastroenterol Nutr 2012; 55(4): 445-50.
5.5 Detection of gluten immunogenic peptides (GIP) in
stools as a method of monitoring the gluten-free diet
in children
Simona Gatti1, Alice Guazzarotti1, Sara Quattrini1, Tiziana Galeazzi1, Carlo Catassi1
1 Università Politecnica delle Marche, Ancona, Italy
Introduction
Methods of evaluating the compliance to the gluten-free diet (GFD) include clinical,
serological and histological tests, but currently a specific, non-invasive and
standardised method is lacking. A recent study has shown that a significant part of α-
gliadin 33-mer (33Eps) is resistant to gastrointestinal (GI) digestion [1]. The G12 and
A1 monoclonal antibodies (mAbs) against the main immunogenic epitope of the α-
gliadin 33-mer, already proven to successfully detect toxic peptides in food samples
[2-3], have recently been tested to quantify immunogenic peptides in faeces. A G12
competitive ELISA test has been shown to easily quantify traces of gluten in faeces
and furthermore a recent study [1] has demonstrated that: 1. the faecal amount of
gluten reflects the ingested quantity; 2. gluten peptides become undetectable after 3-4
days of GFD and appear on day 3 during a gluten challenge.
We aimed to investigate the clinical usefulness of the new fecal test in children with
coeliac disease (CD) and to compare this new method with traditional methods of
evaluating the adherence to the GFD.
Materials and methods
CD children on a GFD for at least 6 months, healthy children on a normal diet and
healthy controls on a GFD for one week were enrolled. A 3-day food diary (including
report of quantities and brands of all the ingredients) was used to monitor the diet
before enrollment. According to the diary, three classes of contamination risks (no
evidence of contamination, possible risk of contamination, clear evidence of
contamination) were identified. Furthermore, we evaluated the overall adherence to the
standards suggested by the Italian Coeliac Society on the supply, preparation, and
consumption of the GF foods, using a 16-point questionnaire. Evaluating the
percentage of correct responses, adherence to the national standards was scored in
three classes: excellent (> 80%), intermediate (60-80%) and poor (< 60%).
Gastrointestinal symptoms were evaluated through the Gastrointestinal Symptoms
Rating Scale (GSRS) [4] and coeliac serology (tTG IgA and DGP IgG antibodies) was
collected within 1 month from the enrollment. The competitive ELISA iVYLISA GIP
(Biomedal Diagnostic, Sevilla) designed to detect and quantify gluten immunogenic
peptides (essentially peptides related to the 33-mer) and based on the G12 antibody was used to analyse the stool samples collected after 3 days of food-record. The kit
contains six standards (100, 50, 25, 12.5, 6.25, 3.12 ng/mL GIP) and the lower
quantitation limit of the assay is 312 ng GIP/g sample (for a sample dilution of 1:10). Correlations between symptoms, food diary, and questionnaire analysis were analysed.
Results and discussion
Seventy-two CD children (mean age: 10.63 ys, SD: 4.78 ys), 16 controls on a normal
diet (mean age: 7.97 ys, SD: 4.66 ys) and 4 healthy volunteers (medical doctors
already trained on the GFD) following a GFD for at least one week were enrolled.
Demographical and clinical data are outlined in Tab. 1.
Table 1. Demographical and clinical features of the study group.
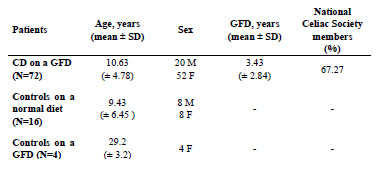
In CD children, the mean GFD duration was 3.43 ys (SD: 2.84 ys). Evaluation of the
compliance to the GFD (including serological, 3-day food diary and questionnaire
results) is summarised in Tab. 2.
Table 2. Evaluation of adherence to the GFD measured by serological data, 3-day
food diary and questionnaire.
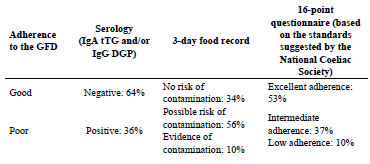
Overall 47% of CD children were found to have detectable amounts of gluten in stools
compared to 100% of controls on a normal diet. Mean GIP values in the CD group
were significantly lower compared to the controls (Fig. 1).
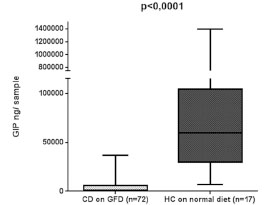
Figure 1. Comparison between fecal GIP levels (ng/g sample) of CD children on a
GFD and healthy controls (HC) on a normal diet
No significant correlation was found between GIP levels and adherence to the diet
(measured by the diary and the questionnaire). Both GI symptoms measured by the
GSRS score and levels of “coeliac autoantibodies” were found to be positively
correlated with GIP values (Fig. 2).
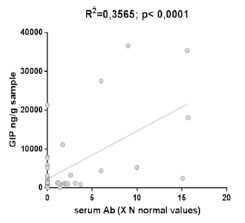
Figure 2. Positive correlation between faecal GIP levels and serum antibodies in
coeliac patients
Analysing serial samples collected from the group of healthy volunteers during 7 days
of GFD, further results were obtained: 1. In some subjects faecal gluten disappeared
more slowly than expected (more than 3 days, as previously described [1]) 2. Some
subjects continued to eliminate gluten despite the GFD, 3. Levels of GIP in stools can
vary more quickly than previously thought (Fig. 3).
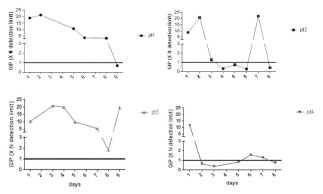
Figure 3. Time to elimination of ingested gluten in the 4 healthy controls well-trained
on the GFD
These final results raised some questions about the specificity of the test and the need
to consider possible confounding environmental factors occurring during sample
collection or the analysis.
Conclusions
The iVYLISA GIP test is a non-invasive, very sensitive, and promising test to assess
the compliance to the GFD, especially in children. Our results show that a high
percentage of CD children have detectable traces of gluten in faeces. This may indicate
incomplete adherence to the GFD and furthermore, we found a significant correlation
with both clinical and serological data. Our preliminary findings need to be replicated
in other centres and possibly compared to a larger group of healthy controls. However,
the presence of gluten in control samples (collected from well-trained subjects on the
GFD) could reflect a low sensitivity of the test. The technique itself is not particularly
challenging, but the analysis is quite long (5 - 6 hours) and can present some minimal
technical problems.
References
1. Comino I, Real A, Vivas S, et al. Monitoring of gluten-free diet compliance in
celiac patients by assessment of gliadin 33-mer equivalent epitopes in feces. Am J
Clin Nutr 2012; 95: 670-7.
2. Moron B, Cebolla A, Manyani H, et al. Sensitive detection of cereal fractions that
are toxic to celiac disease patients by using monoclonal antibodies to a main
immunogenic wheat peptide. Am J Clin Nutr 2008; 87: 405-14.
3. Moron B, Bethune M, Comino I, et al. Toward the assessment of food toxicityfor
celiac patients: Characterization of monoclonal antibodies to a mainimmunogenic
gluten peptide. PLoS ONE 2008; 3: e2294.
4. Lohiniemi S, Mäki M, Kaukinen K, et al. Gastrointestinal symptoms rating scale
in coeliac disease patients on wheat starch-based gluten-free diets. Scand J
Gastroenterol 2000; 35: 947-9.
6 Antigen receptors in coeliac disease
6.1 Molecular basis for T-cell receptor recognition of
HLA-DQ-gluten in coeliac disease
Frits Koning
Department of Immunohematology and Blood Transfusion
Leiden University Medical Centre, Leiden, The Netherlands
Introduction
Gluten-specific T cells are characteristic for coeliac disease (CD) [1]. Here, I briefly
describe the latest observations related to the actual T-cell receptor repertoire that is
associated with this disease-causative T-cell response. In addition, a novel
technological advance allows system-wide analysis of the immune system with
unprecedented resolution. I briefly describe this technology and the implications it
may have for the discovery of tissue- and disease-specific immune signatures.
The gluten-specific T-cell response
CD is characterised by the presence of gluten-specific CD4 T cells in the lamina
propria of the affected organ: the small intestine [1]. Typically, such T cells respond to
modified gluten peptides bound to the disease-predisposing HLA-DQ2 or HLA-DQ8
molecules. The modification of gluten peptides involves the conversion of one or more
glutamine residues in gluten peptides into the negatively charged glutamic acid
residues and this is driven by the activity of the enzyme tissue transglutaminase [2,3].
The introduction of one or more negative charges in gluten peptides facilitates the
binding to HLA-DQ2 or HLA-DQ8 and is thus a likely key step towards the
development of full-blown disease. Although it is not exactly known where this
modification takes place, it is likely to be in the affected tissue itself, as tissue
tranglutaminase is released upon stress and tissue damage.
Gluten is well known to be a complex mixture of α-, γ-, and ω-gliadins and lowmolecular-
weight and high-molecular-weight-glutenins. Immunogenic peptides have
been identified in all of these proteins, the majority of which is restricted by HLADQ2,
the major disease-predisposing allele [4]. Such HLA-DQ2-restricted epitopes are
usually found in proline-rich regions in gluten proteins, protecting them from
enzymatic degradation in the gastrointestinal tract [5]. In contrast, HLA-DQ8 epitopes
are fewer and generally more sensitive to degradation [5]. Thus, it is likely that relative
to HLA-DQ8, HLA-DQ2 will present a larger repertoire and higher numbers of gluten
peptides and this may underlie the larger disease risk conferred by this HLA-DQ allele
[6].
Despite the fact that many antigenic gluten epitopes exist, some appear more relevant,
because they are immunodominant, i.e., recognized by T cells from the majority of
patients. There are now several publications documenting that the T-cell receptor
repertoire, specific for such immunodominant gluten peptides, is biased, as it is
dominated by the expression of particular T-cell receptor Vβ- and/or Vα-gene
segments [7-9]. The potential T-cell receptor repertoire is estimated to exceed 1015,
allowing the generation of a vastly diverse T-cell compartment to cope with the
plethora of surrounding pathogens. The chance that two randomly selected T cells
express a similar T-cell receptor is, therefore, essentially zero. Nevertheless, T cells
specific for immunodominant gluten peptides, isolated from unrelated patients, were
found to express (nearly) the same T-cell receptor Vβ and/or Vα chains, indicating
strong selection and expansion of T cells expressing such receptors in patients with
coeliac disease. While in HLA-DQ2 positive patients such T cells often express the Tcell
receptor TRBV7-2 gene segment [7,9], in HLA-DQ8-associated disease the
TRBV9 gene segment is overrepresented [8]. Strikingly, in such T-cell receptors a
non-germline encoded arginine residue is present in either the CDR3α or CDR3β region. As the CDR3 regions are generated during the recombination process, the
presence of the non-germline encoded arginine is thus the result of the recombination
process and a further indication that there is strong selection for particular T-cell
receptors in the pathogenesis of CD. Structural studies show that this arginine plays a
critical role in the interaction between the gluten-specific T-cell receptors and the
HLA-DQ-gluten complexes, as it is positioned directly above the HLA-bound gluten
peptides, where it makes contact with both the HLA-DQ molecule and the bound
gluten peptide [8,9]. Moreover, these structures reveal the molecular basis for the
selective usage of particular TRBV gene segments, because germline encoded residues
in the V-regions were found to make critical interactions with HLA-DQ-gluten as
well.
What remains to be established is the T-cell receptor repertoire specific for the less
immunodominant gluten peptides and their role in the disease process. An important
issue is whether such T cells are merely bystanders and relatively harmless or by
themselves sufficient for the induction of disease symptoms. In other words, if the T
cells specific for the immunodominant gluten epitopes, would be eliminated, would
that constitute a cure or would the remaining repertoire of T cells still lead to disease
upon gluten consumption? If the former is the case, novel strategies to eliminate T
cells to immunodominant gluten peptides might constitute a cure for CD.
For details please see references 7-9.
High-dimensional analysis of the mucosal immune system
Cells of the immune system play a crucial role in the defense against pathogens as they
survey tissues for the presence of abnormalities, such as infection by bacteria/viruses.
However, there are many disease conditions, where the immune system does not
function properly. These include conditions, where the T-cell response is wrongly directed, e.g., where T cells destroy healthy cells in autoimmune diseases including
type 1 diabetes, rheumatoid arthritis, and CD.
The analysis of cell surface protein expression patterns by fluorochrome-based flow
cytometry has contributed greatly to our understanding of cellular heterogeneity and
cellular differentiation for cell types within the hematopoietic system and beyond.
Flow cytometry has become a benchmark technology for single cell analysis in both
diagnostics and research. Each gradual technical improvement that has resulted in an
ability to measure a larger number of cellular markers in parallel, has been adopted by
the research community very rapidly. In practice, however, this technique has reached
a technical plateau, as the spectral overlap between fluorochromes limits the number
of markers that can simultaneously be monitored. To escape this, plateau flow
cytometry has now been combined with mass spectrometry, termed mass cytometry. In
mass cytometry, the fluorochrome tags are replaced by a series of rare earth elements
(e.g., lanthanides), which are attached to antibodies through metal-chelator coupling
reagents [10]. Cells are labelled by incubation in a cocktail of tagged antibodies; as the
cells flow through the instrument, they are atomised at 5500 K, and the released tags
are identified and quantitated by time-of-flight mass spectrometry (MS). Rates are
reasonable, at 1000 cells/s. The beauty of the approach stems from three factors: the
precision of MS detection, which eliminates overlap between tags; the number of
detectable markers (36 at present but up to 100 in the future); and the absence of
background noise.
We have now developed a 32 antibody panel that has been specifically designed to
delineate the heterogeneity of all immune subsets in the intestinal mucosa. Our
preliminary data demonstrate that this initial antibody panel can be applied to cell
suspensions isolated from intestinal biopsies of patients with Crohn’s disease, CD and
controls. Due to the multidimensionality of the resulting data, the results cannot be
analysed effectively with conventional flow cytometry tools (FACSDiva, FlowJo), but
require dedicated, often cloudbased, software packages, which are all operational.
Together, these methods make it possible to characterise the composition of the
mucosal immune system at unprecedented resolution. Thus, with dedicated antibody
panels it is feasible to obtain comprehensive information on the composition and
characteristics of the immune system in health and disease. Our preliminary results
indicate that both tissue- and disease-specific immune signatures can be detected.
Further optimisation of this approach may lead to the identification of diseaseassociated
biomarkers and improved diagnostics and prognostics.
References
1. Tjon JM, van Bergen J, Koning F. Celiac disease: how complicated can it get?
Immunogenetics 2010; 62: 641-51.
2. Molberg Ø, McAdam S, Körner R, et al. Tissue transglutaminase selectively
modifies gliadin peptides that are recognized by gut derived T cells in celiac
disease. Nature Med 1998; 4: 713-717.
3. van de Wal Y, Kooy YMC, van Veelen P, et al. Selective deamidation by tissue
transglutaminase strongly enhances gliadin-specific T cell reactivity. J Immunol
1998; 161: 1585-1588.
4. Sollid LM, Qiao SW, Anderson RP, et al. Nomenclature and listing of celiac
disease relevant gluten T-cell epitopes restricted by HLA-DQ molecules.
Immunogenetics 2012; 64: 455-60.
5. Shan L, Molberg Ø, Parrot I, et al. Structural basis for gluten intolerance in celiac
sprue. Science 2002; 297: 2275-2279.
6. Vader W, Stepniak D, Kooy Y, et al. The HLA-DQ2 gene dose effect in Celiac
Disease is directly related to the magnitude and breadth of gluten-specific T-cell
responses. Proc Natl Acad Sci USA 2003; 100: 12390-12395.
7. Qiao SW, Christophersen A, Lundin KE, et al. Biased usage and preferred pairing
of alpha- and beta-chains of TCRs specific for an immunodominant gluten epitope
in coeliac disease. Int Immunol 2014; 26: 13-19.
8. Broughton SE, Petersen J, Theodossis A, et al. Biased T cell receptor usage
directed against human leukocyte antigen DQ8-restricted gliadin peptides is
associated with celiac disease. Immunity 2012; 37: 611-621.
9. Petersen J, Montserrat V, Mujico JR, et al. T-cell receptor recognition of HLADQ2-
gliadin complexes associated with celiac disease. Nat Struct Mol Biol 2014;
21: 480-488.
10. Bendall SC, Simonds EF, Qiu P, et al. Single-cell mass cytometry of differential
immune and drug responses across a human hematopoietic continuum. Science
2011; 332: 687-96.
7 Statements by participating organisations,
representatives from industry and guests
7.1 Current regulatory status on gluten-free claims
Johan De Meester1
1 Cargill R&D Centre Europe, Vilvoorde, Belgium
Introduction
Codex Standard 118-1979, revised in 2008, sets a standard for foods for special dietary
use for persons intolerant to gluten. Similarly and applying from 1st January 2012
onwards, Regulation (EC) 41/2009 sets compositional and labelling standards for
foods claiming to have low gluten content, the allowed claims being “gluten-free” and/or “very low gluten.” Gluten-free products can be foods specially produced,
prepared and/or processed to meet the special dietary needs of people intolerant to
gluten, as well as conventional products, but in all cases their gluten content shall not
be higher than 20 parts per million (mg/kg) gluten.
“Very low gluten” claim foods must be specially prepared and/or processed to meet
the special dietary needs of people intolerant to gluten. These are foods containing
ingredients made from wheat, rye, barley, oats, or their crossbred varieties that have
been specially processed to remove gluten. Very low gluten food must contain no
more than 100 mg/kg gluten. Very low gluten food may also bear a gluten-free claim
when meeting the 20 mg/kg threshold.
The EU legislator has recasted the current legislation on food for particular nutritional
uses, which resulted in a transfer of the current regulatory standard for very low gluten
and gluten-free claims under the scope of the Food Information Regulation (EU)
1169/2011.
In the following paragraphs, an update is provided on the significant legislative
changes and steps that were required to transfer the provisions on gluten-free claims
from Regulation (EC) 41/2009 to the Food Information Regulation (EU) 1169/2011.
Also attention is provided to compare the gluten-free claims in different geographies
with the current applicable gluten-free provisions in relation to the Codex Standard
118-1979 (rev. 2008). The goal was to provide an overview, in which geographies
gluten-free claims are introduced in line with the Codex Standard 118-1979 (rev.
2008).
Steps taken by the EU Commission on recasting gluten-free claims
Commission Regulation (EC) No 41/2009 of 20 January 2009 [1], concerning the
composition and labelling of foodstuffs suitable for people intolerant to gluten sets out harmonised rules on the information that is provided to consumers on the absence or
reduced presence of gluten in food. In 2012, the EU Commission proposed to recast
Directive 2009/39/EC [2], which establishes the legislative framework for foodstuffs
for particular nutritional uses, so-called 'dietetic foods'.
The EU Commission envisaged thus to cover foodstuffs for persons, who are glutenintolerant
under the regulation for particular nutrition. If gluten-free claims would no
longer be regulated under Regulation (EC) 41/2009, they would need to be compliant
with the provisions of the Regulation (EC) No 1924/2006 [3], which is for healthy
people following a nutritional profile. A number of stakeholders did not perceive this
as the way forward [4], since the HNC Regulation is not the right legislation for
addressing the needs of people with particular nutritional requirements. Coeliac
patients but also any category of consumers would not profit from such a proposed
recasting of the legislation. Coeliac patients require a certain diet to remain healthy.
On 29 February 2012, the EP ENVI Committee voted to support significant
amendments on the regulation for particular nutrition. With regard to food, suitable for
people intolerant to gluten, the Committee proposed that these statements should be
regulated solely by the Food Information Regulation (EU) 1169/2011 [5].
Regulation (EU) No 1169/2011 of the European Parliament and of the Council of 25
October 2011 on the provision of food information to consumers sets out rules on
information to be provided for all food, including non prepacked food, on the presence
of ingredients, such as gluten-containing ingredients, with a scientifically proven
allergenic or intolerance effect in order to enable consumers, particularly those
suffering from a food allergy or intolerance, such as gluten intolerance, to make
informed choices, which are safe for them.
Regulation (EU) No 609/2013 of the European Parliament and the Council of 12 June
2013 [6] on food intended for infants and young children, food for special medical
purposes, and total diet replacement for weight control introduces a new legal status
for labelling of foodstuffs suitable for people intolerant to gluten.
Directive 2009/39/EC and Regulation (EC) No 41/2009 will be repealed by Regulation
(EU) No 609/2013 of the European Parliament and of the Council of 12 June 2013 on
food intended for infants and young children, food for special medical purposes, and
total diet replacement for weight control. Nevertheless, consumers should continue to
be appropriately informed and not misled or confused, when information on the
absence or reduced presence of gluten in foods is provided by food business operators
after the repeal of Regulation (EC) No 41/2009. To this end, it is necessary to transfer
the existing rules under a different legal framework. In this context, Regulation (EU)
No 609/2013 foresees that for the sake of clarity and consistency, the rules on the use
of the statements 'gluten-free' and 'very low gluten' should be regulated under
Regulation (EU) No 1169/2011.
The provisions concerning these products shall be transferred to Regulation (EU) No
1169/2011 on the provision of food information to consumers, guaranteeing consumers the same levels of protection offered by the current Regulation (EC) No
41/2009 concerning the composition and labelling of foodstuffs suitable for people
intolerant to gluten.
The European Commission shall, therefore, firstly adopt a delegated act to modify
Chapter 3 of Article 36 of Regulation (EU) No 1169/2011. This modification shall
enable the Commission, via an implementation act in a subsequent phase, to establish
the requirements applicable to the information on the absence or reduced presence of
gluten in food products.
Article 36(2) of Regulation (EU) No 1169/2011 requires that information, provided by
food business operators, shall not mislead the consumer, shall not be ambiguous or
confusing for the consumer and shall, where appropriate, be based on the relevant
scientific data. To that effect, Article 36(3) of that Regulation requires the Commission
to adopt implementing acts on the application of the requirements referred to in
paragraph 2 of the same Article in certain specific cases identified therein.
In order to ensure that consumers are appropriately informed and not misled or
confused by information, provided by food business operators on a divergent basis,
Article 36(4) of that Regulation provides for the possibility for the Commission to
supplement, by means of delegated acts, Article 36(3) with additional cases of
provision of food information, for which the Commission shall adopt implementing
acts on the application of the requirements referred to in Article 36(2).
This Delegated Regulation amends Article 36(3) of Regulation (EU) No 1169/2011 by
supplementing it with the addition of a new letter (d): 'information on the absence or
reduced presence of gluten in food'.
Following its adoption, the Commission intends to prepare an implementing act on the
basis of amended Article 36(3) of Regulation (EU) No 1169/2011 in order to transfer
the rules of Commission Regulation (EU) No 41/2009 under the new legislative
framework of Regulation (EU) No 1169/2011.
Commission Delegated Regulation (EU) No 1155/2013 of 21 August 2013 [7],
amending Regulation (EU) No 1169/2011 of the European Parliament and of the
Council on the provision of food information to consumers as regards information on
the absence or reduced presence of gluten in food.
The Commission has subsequently published the Commission Implementing
Regulation (EU) No 828/2014, of 30 July 2014 [8], on the requirements for the
provision of information to consumers on the absence or reduced presence of gluten in
food, establishing the criteria that enable the use of the terms “gluten-free” and “very
low gluten” in food. These statements could also include "suitable for people intolerant
to gluten" or "suitable for coeliacs". In the case of foods specifically produced,
prepared and/or processed to meet special nutritional requirements of the coeliac
community, the use of additional expressions such as "specifically formulated for
people intolerant to gluten" or "specifically formulated for coeliacs" is possible.
This Regulation shall be applicable from 20 July 2016, when Regulation (EC) No
41/2009, of 20 January 2009, concerning the composition and labelling of foodstuffs
suitable for people intolerant to gluten, will be abrogated. Also Parnuts Framework
Directive 2009/39 will be abolished on 20 July 2016.
Gluten-free claims in other geographies
Codex Standard for foods for special dietary use for persons intolerant to gluten 118-
1979 (rev. 2008) [9] foresees in contradiction to Commission Regulation (EC) No
41/2009 of 20 January 2009 a number of analytical details. Codex 118-1979 (rev.
2008) points out that the antibody, used for gluten analysis in foods, should react with
cereal protein fractions toxic for persons intolerant to gluten – and not cross-react with
other cereal proteins or other constituent of foods/ingredients. The detection limit
should be appropriate according to the state of the art. It should be 10 mg gluten/kg or
below. Reference is made to the enzyme-linked immunoassay (ELISA) R5 Mendez
method.
In other geographies, also limits are set for gluten-free and low in gluten. In a number
of geographies and countries, regulatory references are found, which establish levels
for gluten-free and low in gluten. In Tab. 1, some more details are summarised.
Only in Europe we have found provisions in regulations that are mirroring the glutenfree
and low in gluten limits as set out in the Codex Standard. Canada and USA have
also a limit on gluten-free of 20 mg/kg or less.
Table 1. Limits for gluten-free and low in gluten in different geographies.
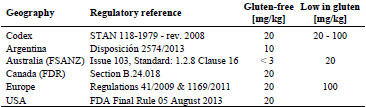
Division 24 of the Food and Drug Regulations (FDR) from Health Canada sets out
specific regulations that apply to "Foods for Special Dietary Use". As of August 4,
2012, section B.24.018 of the Food and Drug Regulations will state that: “It is
prohibited to label a food in a manner likely to create an impression that it is a glutenfree
food, if the food contains any gluten protein or modified gluten protein, including
any gluten protein fraction, referred to in the definition "gluten.” [10,11].
In August 2004, the FDA has provided for a clear regulatory framework on allergens
referred to as FALCPA (Food Allergen Labeling and Consumer Protection Act -
Public Law 108-282, Title II) [12]. In 2007, the FDA outlined a proposed definition
for “gluten-free” and solicited feedback. So it took the FDA almost a decade to provide for the necessary direction on the labelling of gluten-free products. On 5th
August 2013, FDA issued a final rule to define the term “gluten-free” for voluntary
use in the labelling of foods. Establishing a definition of the term “gluten-free” and
uniform conditions for its use in food labelling will help ensure that American
consumers with coeliac disease are provided truthful and accurate information with
respect to foods labelled gluten-free. Gluten-free labelling (< 20 mg/kg) for foods is
accepted to carry the label “gluten-free,” “no gluten”, “free of gluten”, or “without
gluten” without special preference of the wording for the specific labelling. The final
rule issued by FDA gave a deadline of compliance by 5th August 2014 [13].
Argentina has in Disposición 2574/2013 defined 'gluten-free' as gluten in food below
10 mg/kg. This decree is part of the foods code in Argentina (Artículo 1383 del
Código Alimentario Argentino).
Australia and New Zealand have two limits described in the Food Safety Australia
New Zealand code (FSANZ). Gluten-free products should have less than 3 mg/kg of
gluten, which is the limit of detection of the R5 antibody method. Products low in
gluten in Australia and NZ should be not more than 20 mg/kg.
Conclusions
The EU Commission has established in Regulation (EU) No. 609/2013 that the rules
on the use of the statements ‘gluten-free’ and ‘very low gluten’ should be in the future
regulated under the FIR, in particular under Article 21 of the FIR on the labelling of
certain substances or products causing allergies or intolerances listed in Annex II to
the FIR. Regulation (EU) No. 609/2013 also sets out that the legal acts to be adopted
pursuant to Regulation (EU) No. 1169/2011, which are to transfer the rules on the use
of the statements ‘gluten-free’ and ‘very low gluten’, as contained in Regulation (EC)
No. 41/2009, must ensure at least the same level of protection for people that are
intolerant to gluten as currently provided for under Regulation (EC) No. 41/2009. That
transfer of rules should be completed before 20 July 2016.
Furthermore, the EU Commission must consider, according to Recital 41 of
Regulation (EU) No. 609/2013, how to ensure that those, who are intolerant to gluten,
are adequately informed of the difference between a food that is specially produced,
prepared and/or processed in order to reduce the gluten content of one or more glutencontaining
ingredients and other food that is made exclusively from ingredients
naturally free of gluten.
At the international level, the Codex Standard for foods for special dietary use for
persons intolerant to gluten not only addresses the use of ‘gluten-free’ labels, but it
also sets requirements for the use of the statement ‘this food is by its nature glutenfree’.
An equivalent provision must be adopted in the EU before 20 July 2016.
References
1. Commission Regulation (EC) No 41/2009 of 20 January 2009 concerning the
composition and labelling of foodstuffs suitable for people intolerant to gluten. OJ
L 16, 21.1.2009; pp. 3-5.
2. Directive 2009/39/EC of the European Parliament and of the Council of 6 May
2009 on foodstuffs intended for particular nutritional uses (recast). OJ L 124,
20.5.2009; pp. 21-29.
3. Regulation (EC) No 1924/2006 of the European Parliament and of the Council of
20 December 2006 on nutrition and health claims made on food. OJ L 404,
30.12.2006; pp. 9-25.
4. Granel G, De Meester J. Current regulatory status in the EU on “gluten free”. In:
Koehler P (ed.) Proceedings of the 26th Meeting of the Working Group on
Prolamin Analysis and Toxicity. Verlag Deutsche Forschungsanstalt für
Lebensmittelchemie (DFA), 2013; pp. 107-110.
5. Regulation (EU) No 1169/2011 of the European Parliament and of the Council of
25 October 2011 on the provision of food information to consumers, amending
Regulations (EC) No 1924/2006 and (EC) No 1925/2006 of the European
Parliament and of the Council, and repealing Commission Directive 87/250/EEC,
Council Directive 90/496/EEC, Commission Directive 1999/10/EC, Directive
2000/13/EC of the European Parliament and of the Council, Commission
Directives 2002/67/EC and 2008/5/EC and Commission Regulation (EC) No
608/2004. OJ L 304, 22.11.2011; pp. 18-63.
6. Regulation (EU) No 609/2013 of the European Parliament and of the Council of
12 June 2013 on food intended for infants and young children, food for special
medical purposes, and total diet replacement for weight control and repealing
Council Directive 92/52/EEC, Commission Directives 96/8/EC, 1999/21/EC,
2006/125/EC and 2006/141/EC, Directive 2009/39/EC of the European Parliament
and of the Council and Commission Regulations (EC) No 41/2009 and (EC) No
953/2009 Commission Delegated Regulation (EU) No 1155/2013 of 21 August
2013 amending Regulation (EU) No 1169/2011 of the European Parliament and of
the Council on the provision of food information to consumers as regards
information on the absence or reduced presence of gluten in food. OJ L 181,
29.6.2013; pp. 35-56.
7. Commission Delegated Regulation (EU) No 1155/2013 of 21 August 2013
amending Regulation (EU) No 1169/2011 of the European Parliament and of the
Council on the provision of food information to consumers as regards information
on the absence or reduced presence of gluten in food. OJ L 306, 16.11.2013; p.7.
8. Commission Implementing Regulation (EU) No 828/2014 of 30 July 2014 on the
requirements for the provision of information to consumers on the absence or
reduced presence of gluten in food OJ L 228, 31.7.2014; pp. 5-8.
9. Codex Standard for Foods for Special Dietary Use for Persons Intolerant to
Gluten. Codex Stan 118-1979 (rev. 2008).
10. Abbott M. Gluten analysis and legislation – A North American view. In: Koehler
P (ed.) Proceedings of the 26th Meeting of the Working Group on Prolamin
Analysis and Toxicity. Verlag Deutsche Forschungsanstalt für Lebensmittelchemie
(DFA), 2013; pp. 101-105.
11. Health Canada website Health Canada’s Position on Gluten-Free Claims http://hcsc.
gc.ca/fn-an/securit/allerg/cel-coe/gluten-position-eng.php#fnb4
12. Federal Register, 76, No. 149, 2011, Proposed Rules
http://www.gpo.gov/fdsys/pkg/FR-2011-08-03/pdf/2011-19620.pdf
13. FDA factsheet on Gluten Free Rule
http://www.fda.gov/downloads/Food/GuidanceRegulation/GuidanceDocumentsRe
gulatoryInformation/Allergens/UCM407878.pdf
7.2 Towards the production of reference materials for
food allergen and gluten-free analysis for improved
food safety management
Peter Koehler1, Lívia Hajas2, Sándor Tömösközi2, Roland Poms3
1 Deutsche Forschungsanstalt für Lebensmittelchemie, Leibniz Institut, Freising,
Germany
2 Budapest University of Technology and Economics, Department of Applied
Biotechnology and Food Science, Budapest, Hungary
3 MoniQA Association, Vienna, Austria
Introduction
It is one of the aims of MoniQA - Monitoring and Quality Assurance in the Total Food
Supply Chain (www.moniqa.org) - the global food safety network registered as
MoniQA Association, to provide guidelines for method validation, reference materials
and to assess the reliability of methods through validation studies and proficiency
testing schemes. In 2013, MoniQA initiated a task force on the development of
reference materials for food allergen and gluten analysis. The task force is an
international group comprised of several standardisation organisations (SDOs),
industry representatives, policy makers, test kit providers, method developers,
analytical companies, as well as representatives from research groups. The chairman
of the Working Group on Prolamin Analysis and Toxicity (PWG) is part of the group.
Three aims are in the focus of the task force: (i) To develop, prepare, and provide wellcharacterised
commodity materials for the further production of incurred reference
materials, spiked samples, and extracts; (ii) to generate and publish a guidance
document on the special requirements and production of allergen reference materials;
(iii) to seek general acceptance of the reference materials and the guideline by the
international community (e.g., EU authorities, Codex Alimentarius, AOAC
International). Priority commodities were identified as being gluten, milk, egg, peanut,
hazelnut, and soy. This short overview reports the current status of the production of
gluten reference materials.
Materials and methods
Grain material was sourced from all over the world to get a broad spectrum of genetic
and technological variants. Twenty-one wheat, two rye, and four barley varieties from
Australia, Austria, Canada, China, Germany, and Hungary were compiled. The grains
were milled into white flour on a laboratory mill (Quadrumat Junior, Brabender,
Germany) and characterised (Fig. 1). Among the different methods were NIR
spectrometry (basic composition), analysis of the crude protein content (N x 5.7) according to the method of Dumas, determination of the wet and dry gluten content
after washing of the dough by a glutomatic, one-dimensional SDS-PAGE to determine
the composition of protein subunits, and extraction/RP-HPLC to quantitate the
composition of protein fractions and protein types. The ELISA response of flours will
be determined using different test kits. Model matrices incurred with selected
individual varieties will be prepared and analysed using several ELISA kits.
In parallel with collecting and characterising the varieties, a preliminary experiment
was performed to estimate the effects of genetic and environmental variability of
wheat on the ELISA measurements. Three flour mixtures were prepared (mixture 1:
Mv-Magvas, Mv-Mazurka, Mv-Verbunkos, Yumai-34, Dekan from the harvest year
2011; mixture 2: same as mixture 1 but from the harvest year 2012; mixture 3: Mv-
Magvas, Bezostaja-1, Hereward, Soissons, Glenlea from the harvest year 2012) and
compared to flour from one wheat variety (Mv-Magvas, harvest years 2011 and 2012,
respectively). The ELISA responses were determined in unprocessed and processed
model matrices using RIDASCREEN® Gliadin (R7001, R-Biopharm AG),
AgraQuant® Gluten Assay (COKAL0248, Romer Labs), and AgraQuant® Gluten G12
Assay (COKAL0200, Romer Labs).
Results and discussion
The idea of the initiative was to produce incurred materials, extracts at different gluten
concentrations, and model foods, e.g., a rice cookie with exactly specified gluten
content. For this purpose, a selection of grain samples should be milled to obtain
minimally processed starting materials (flours), which had to be thoroughly
characterised for as many as possible ingredients, in particular for their gluten content.
The intended workflow is shown in Fig. 1.
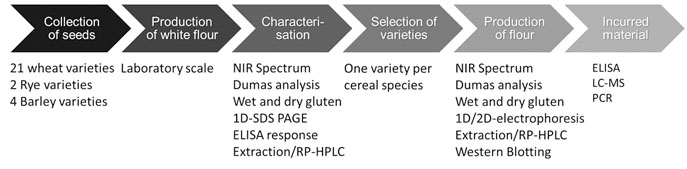
Figure 1. Schematic representation of the workflow for the development of reference
materials for gluten analysis
Challenges and questions had to be faced in the beginning. For example, should one or
a mixture of varieties be used for flour production, was the geographic origin
important, was white flour or whole grain flour more suitable? White flour is stable
and appropriate for gluten detection, whereas whole grain flour additionally contains
putative allergens from the outer layers (e.g., aleurone), but is less stable. Therefore,
periodic quality control analysis and stability testing is required during storage.
Defined amounts of wheat flours made from one variety or from a mixture of five
varieties as well as PWG gliadin were added to a cookie recipe. PWG-gliadin was
used as a reference material. The blends of dry raw materials as well as baked cookies
were analysed using three ELISA kits and the recoveries based on the nominal gliadin
concentrations were determined. The nominal gliadin concentration was calculeted
according to the weight of added flours to the cookie recipe and the gluten content of
flour determined by the Glutomatic System. The results are shown in Fig. 2. Gliadin
recovery was strongly dependent on the ELISA kit used for analysis. Whereas Kit A
and Kit B yielded comparable results, Kit C provided gluten concentrations that were
approximately 3.5 times higher than the target values. However, the experiment also
showed that there were only small differences in the ELISA response between samples
from one variety and mixtures of varieties. Based on this result, it can be assumed that
it is sufficient to use only one variety as the basis for reference material production.
The first criterion for the selection of a variety was based on SDS-PAGE. A suitable
variety should have five high-molecular-weight glutenin subunits (HMW-GS) and a
typical pattern of ω-gliadins. No significant differences were identified in the band
pattern of low-molecular-weight glutenin subunits (LMW-GS) and gliadins. The
second criterion was the RP-HPLC analysis. Typical gliadin and glutenin patterns as
well as a typical gliadin/glutenin ratio were considered. Based on the results, it will be
decided whether one variety or a mixture will be used for further work.
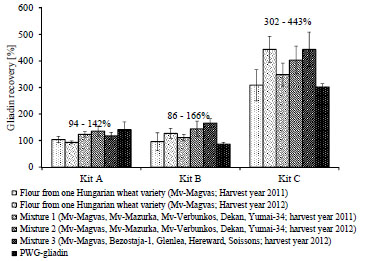
Figure 2. Recovery of gliadins from different wheat flours and flour mixtures in the
blend of dry ingredients of cookie recipe using three different ELISA kits
Outlook
Rye and barley varieties for reference material production will be identified as
described for wheat. A rice cookie recipe will be finalised in the first half of 2015 so
that incurred reference materials with given gluten content can be prepared. This will
be characterised in parallel by the different research institutes involved in the
initiative. The first samples for research/trial purposes (small quantities) should be
available through MoniQA Association in 2016. Publication of a mini-review and
opinion paper as well as a guidance document on best practice production of food
allergen reference materials is targeted for late 2015.
7.3 Industrial view on the approval of novel methods for
gluten quantitation
Gunnar Adås, Henrik Dahlquist
Fria Gluten Free, Västra Frölunda, Sweden
There are ongoing discussions to approve further methods of analysis for the
determination of the gluten content in addition to the existing Mendez R5-ELISA.
There is a need for other methods to be approved for different reasons.
As a food producer, we want to highlight the possible consequences of changed or
altered approved methods of analysis. If the results of novel methods do not
correspond to the results of existing methods, the basis for decision-making in the
industry will become more difficult and sometimes confusing. The food industry
depends on long-term and stable regulations. Our worry is that the approval of novel
methods might lead to future changes of the legal regulations.
Like many other food producers, Fria Gluten Free uses gluten-free wheat starch as the
main ingredient in gluten-free bread. As analysed by the Mendez R5-ELISA, the
gluten content is well below 20 mg/kg complying with the threshold and the analytical
method required for a gluten-free claim. Consumption of food in line with this
regulation has been agreed to be safe for persons with coeliac disease.
Our statement: Do not recommend any novel methods for quantitation of the gluten
content, unless they have been tested using bread baked with gluten-free wheat starch
and the results are comparable to those obtained with the Mendez R5-ELISA.
8 Perspectives and action plan of the PWG
Peter Koehler
German Research Centre for Food Chemistry, Freising, Germany
The Prolamin Working Group executive meeting and joint discussion held on 26th of
September 2014 led to the decisions outlined below.
Action plan
I. Analytical
Peter Koehler is responsible for the PWG gliadin reference material
(Peter.Koehler@tum.de).
PWG gliadin will continue being the reference material supported by the group. Material for five to ten years is still in stock.
Plans for research towards new reference materials have been discussed:
- Isolation of protein reference materials from reference flours of the MoniQA
initiative (end 2015/beginning 2016).
- Possible project proposal in the Horizon 2020 program of the EU on reference
materials based on synthetic peptides or proteins.
- Dr. Roland Poms (MoniQA) will be invited to give a presentation on reference
materials at the 2015 meeting.
Collaborative studies on gluten quantitation in collaboration with AOACI and
AACCI will continue.
II. Clinical
At the 2015 meeting, a symposium on “Innate immunity and coeliac disease” will be held. Speakers will be Bana Jabri, Riccardo Troncone, and Detlef
Schuppan.
III. Members, Policy
Dr. Renate van Eckert (Wellington, New Zealand) will leave the group.
Prof. Nadine Cerf-Bensussan has been identified as a potential new member of
the group.
The website will be updated (Fernando Chirdo).
This printed, citable book (print run: 300 copies with ISBN number) was made
possible by funding of Dr. SCHÄR GmbH/Srl, (Burgstall, BZ, Italy) and by the
help of Mrs. Anneliese Stoiber and Dr. Gaby Andersen, Deutsche Forschungsanstalt
für Lebensmittelchemie (Freising, Germany). It will be distributed
among leaders of opinion in gluten analysis and clinical medicine.
Next meeting: 2015
We are very pleased to announce the venue for our meeting in 2015:
Tulln, Austria
Host:
Mag. Simone Schreiter
Romer Labs Division Holding GmbH
Technopark 1, 3430 Tulln, Austria
Phone: +43 664 8842 7934
Fax: +43 2272 615 3313111
E-mail: simone.schreiter@romerlabs.com
Time: October 8 – 10, 2015
Focus of the meeting:
Innate immunity and coeliac disease
Gluten quantitation (immunochemical/non-immunochemical)
Gluten reference materials for analytical and clinical studies
The meeting will be limited to 50 participants and attendance is by
invitation only. Invitations will be sent by April 2015. Registration
deadline will be June 15, 2015.
For registration please contact:
Simone Schreiter
(address: see above)
Very special thanks to the host of this kind invitation!
|
|
List of Participants
GROUP MEMBERS
Prof. Dr. Carlo Catassi
Università politecnica delle marche Facoltà di Medicina e Chirurgia
Istituto di Clinica Pediatrica
Via Corridoni 11 - 60123 ANCONA, IT ALY
Phone +39 349 2235 447 | Tele fax +39 071 36281
Email: catassi@tin.it
Prof. Dr. Fernando G. Chirdo
Laboratorio de Investigación en el Sistema Inmune (LISIN)
Facultad de Ciencias Exactas Universidad Nacional de La Plata cc 711
(1900) LA PLATA, ARGENTINA
Phone: +54 221 421 0 497 | 423 0 121 | 423 5 333 (Int 45)
Tele fax +54 221 422 6947
Email: fchirdo@biol.unlp.edu.ar
Prof. Paul J. Ciclitira
King's College London (Division of Diabetes and Nutritional Sciences) The Rayne Institute (KCL). St Thomas' Hospital Westminster Bridge Road. LONDON SE1 7EH, UK/ENGLAND
Phone: +44 207 620 2597 | 207 188 2494 | Telefax +44 207 261 0667
Email: mila.labar_weintrop@kcl.ac.uk (secretary)
Email: paul.ciclitira@kcl.ac.uk
Prof. Conleth Feighery, MD
(not at tend ing)
University of Dublin Department of Immunology St. James's Hospital James's Street DUB LIN 8, IRELAND
Phone: +353 1 896 3432 | Tele fax +353 1 4545-609
Email: con.feighery@tcd.ie
Dr. Luud Gilissen
Plant Research International (PRI) Wageningen University
Droevendaalsesteeg 1 6708 PB WAGENINGEN, THE NETHERLANDS
Phone: +31 317-480983 | Fax: +31 317-418094
Email: luud.gilissen@wur.nl
Prof. Dr. Peter Köehler
Deut sche Forschungsanstalt für Lebensmittelchemie
Lise-Meitner-Straße : +34 - 85354
FREISING, GER MANY
Phone: +49 81 61 71 29 28 | Tele fax +49 81 61 71 29 70
Email: peter.koehler@tum.de
Prof. Dr. Frits Koning
Leiden Univer sity Medical Center, E3-Q
Department of Immunohaematology and Bloodbank Albinusdreef 2
2333 ZA LEIDEN, THE NETHERLANDS
Phone: +31 71 5266673 | Tele fax +31 71 5265267
Email: fkoning@lumc.nl
Prof. Dr. Knut Lundin
Oslo Universitetssykehus
HF Rikshospitalet
Postboks 495
N-0424 OSLO, NORWAY
Phone: + 47 909 80325
Fax: +47 2307 2410
Email: k.e.a.lundin@medisin.uio.no
Prof. Dr. Thomas Mothes
Universitätsklinikum Leip zig A. ö. R.
Institut für Laboratoriumsmedizin, Klinische Chemie und Molekulare Diagnostik - Liebigstraße : 27 - 04103
LEIPZIG, GERMANY
Phone: +49 341 97 22251 | Tele fax +49 341 97 22329
Email: mothes@medizin.uni-leipzig.de
Prof. Dr. Dr. Detlef Schuppan
I. Medizinische Klinik und Poliklinik Universitätsmedizin der Johannes
Gutenberg-Universität Mainz Langenbeckstr. 1,55131 MAINZ, GERMANY
Phone +49 6131-177355/ 177356/177104 - Fax +49 6131-177357
Email: detlef.schuppan@unimedizinmainz.de
Prof. Dr. Martin Stern
Universitätsklinik für Kinder- und Jugendmedizin Hoppe-Seyler-Straße 1
72076 TÜBINGEN, GER MANY
Phone: +49 7071 29 83781 | Tele fax +49 7071 29 5477
Email: martin.stern@med.uni-tuebingen.de
Prof. Dr. Riccardo Troncone (not attending)
Department of Pediatrics and European Laboratory for the Investigation of Food-induced Diseases University of Naples “Federico II”- via Pansini, 5 - 80131 NAPLES, ITALY
Phone: +39 081 7463383 | Telefax +39 081 5469811
Email: troncone@unina.it
HOSTS
Dr. Sandra Denery
INRA
Rue de la Géraudière BP 71627
44316 NANTES CEDEX 3, FRANCE
Phone: +33 2 40675137
Fax: +33 2 40675025
E-mail: sandra.denery@nantes.inra.fr
Dr. Olivier Tranquet
INRA
Rue de la Géraudière BP 71627
44316 NANTES CEDEX 3, FRANCE
Phone: +33 2 40675027
Fax: +33 240675025
E-mail: olivier.tranquet@nantes.inra.fr
INVITED SPEAKER
Prof. Dr. Nadine Cerf-Bensussan
Imagine, Institute of Genetic Diseases
Laboratoire d’Immunité Intestinale
Boulevard du Montparnasse
75015 PARIS, FRANCE
Phone: +33 142754288
Fax: +33 142754223
Email: nadine.cerf-bensussan@inserm.fr
GUESTS
Mr. Gunnar Adas
Fria Gluten Free
Fältspatsgatan 12
42130 VÄSTRA FRÖLUNDA, SWEDEN
Phone: +46 708684852
Fax: +46 317341335
Email: gunnar@fria.se
Mrs. Tova Almlöf
Semper AB
Semper AB Box 1101
SE 17222 SUNDBYBERG, SWEDEN
Phone : +46 850593100
Email: Tova.Almlof@semper.se
Mrs. Sofia Beisel
Deutsche Zöliakie Gesellschaft eV
Kupferstr 36
70565 STUTTGART, GERMANY
Phone: +49 71145998115
Fax: 49 71145998150
Email: sofia.beisel@dzg-online.de
Ms. Barbara Bidan
Fleury Michon
Rue de Pierre Brune
85110 CHANTONNAY, FRANCE
Email: bidan.barbara@fleurymichon.fr
Dr. Marie Bodinie
INRA
Rue de la Géraudière BP 71627
44316 NANTES CEDEX 3, FRANCE
Phone: +33 2 40675000
Email: marie.bodinier@nantes.inra.fr
Mr. Gregory Bouchaud
INRA
Rue de la Géraudière BP 71627
44316 NANTES CEDEX 3, FRANCE
Phone: +33 2 40675000
Email: gregory.bouchaud@nantes.inra.fr
Dr. Markus Brandt
Ernst Böcker GmbH & Co KG
Ringstrasse55-57
32423 MINDEN, GERMANY
Phone: +49 571 837990
Fax: +49 571 8379920
Email: markus.brandt@sauerteig.de
Mrs. Laurie Brard
INRA
Rue de la Géraudière BP 71627
44316 NANTES CEDEX 3, FRANCE
Phone: +33 2 40675039
Fax: +33 2 40675043
Email: wgpat2014meeting@nantes.inra.fr
Mrs. Ilona Bruins Slot
RIKILT Wageningen UR
Institute of Food Safety
Akkermaalsbos 2
6708 WB WAGENINGEN
THE NETHERLANDS
Phone: +31 317 480388
Email: ilona.bruinsslot@wur.nl
Mr. Henrik Dahlquist
Fria Bröd AB
Fältspatsgatan 12
421 30 VÄSTRA FRÖLUNDA,
SWEDEN
Phone: +46 70 654 600
Fax: +46 317341335
Email: Henrik.Dalquist@fria.se
Mrs. Hertha Deutsch
Österreichische Arbeitsgemeinschaft
Zöliakie
Anton Baumgartner Straße 44/C5/2302
1230 VIENNA, AUSTRIA
Phone: +43 166 71887
Email: hertha.deutsch@utanet.at
Mr. Elias Diaz Ramiro
Instituto Nacional des Consumo
Centro de Investiagción y Control
de la Calidad
Avenida Cantabria, 52
28042 MADRID, SPAIN
Phone: +34 918224744
Email: elias.diaz@consumo-inc.es
Dr. Clyde Don
Foodphysica
Vogelwikke 12
6665 HP DRIEL, THE NETHERLANDS
Phone: +31 622 543047
Email: clyde.don@foodphysica.com
Dr. Jean Dunne
University of Dublin
Department of Immunology,
St. James´s Hospital
James´s Street
DUBLIN 8, IRELAND
Phone: +353 1 416 2921
Fax: +353 1 454 5609
Email: dunnej1@tcd.ie
Mr. Lukas Frank
Romer Labs Divison Holding GmbH
Technopark 1
3430 TULLN, AUSTRIA
Tel: +43 2272 615 33 13155
Fax: +43 2272 615 33 13111
Email: lukas.frank@romerlabs.com
Dr. Gyöngyvér Gell
MTA Centre of Agricultural Research
Department of Applied Genomics
Brunszvik 2
2462 MARTONVÁSÁR, HUNGARY
Phone: +36 225 69521
Fax: +36 225 69514
Email: gell.gyongyver@agrar.mta.hu
Dr. Thomas Grace
Bia Diagnostics
294 N. Winooski Ave, Ste 116A
VT 05401 BURLINGTON, USA
Phone: +1 802 5400148
Fax: +1 802 5400147
Email: thomasgrace@biadiagnostics.com
Mrs. Robin Grace
Bia Diagnostics
294 N. Winooski Ave, Ste 116A
VT 05401 BURLINGTON, USA
Phone: +1 802 5400148
Fax: +1 802 5400147
Email: robin@biadiagnostics.com
Mrs. Gertrud Granel
Association of German Cereal
Processors and Starch Producers
(VDGS e.V.)
Johannesstraße 37
53225 BONN, GERMANY
Phone: +49 30 8892368915
Fax: +49 30 88923689 19
Email: granel@vdgs.org
Dr. Reka Haraszi
Campden BRI
Station road
CHIPPING CAMPDEN,
GL55 6LD, UK
Phone: 00441386842240
Email: reka.haraszi@campdenbri.co.uk
Dr. Angéla Juhász
MTA Centre of Agricultural Research
Department of Applied Genomics
Brunszvik 2
2462 MARTONVÁSÁR, HUNGARY
Phone: +36 225 69531
Fax: +36 225 69514
Email: juhasz.angela@agrar.mta.hu
Dr. Päivi Kanerva
Department of Food and
Environmental Sciences
University of Helsinki
Agnes Sjöbergin katu 2
P.O. Box 66
00014 HELSINKI, FINNLAND
Phone: +358 405 084 064
Fax: +358 9 191 58475
Email: paivi.kanerva@helsinki.fi
Dr. Katharina Scherf
Deutsche Forschungsanstalt für
Lebensmittelchemie
Lise Meitner-Strasse 34
85354 FREISING, GERMANY
Phone: +49 8161712927
Fax: +49 8161712970
Email: katharina.scherf@Lrz.tum.de
Dr. Colette Larre
INRA
Rue de la Géraudière BP 71627
44316 NANTES CEDEX 3, FRANCE
Phone: +33 240675000
Fax: +33 240675025
Email: colette.larre@nantes.inra.fr
Mrs. Stelle Lindeke
R-Biopharm AG
An der neuen Bergstraße 17
64297 DARMSTADT, GERMANY
Phone: +49 6151 810225
Fax: +49 6151 8102734
Email: s.lindeke@r-biopharm.de
Dr. Jussi Loponen
Fazer Group
Fazerintie 6
FI-01230 Vantaa
P.O. Box 4
00941 HELSINKI, FINNLAND
Phone: +358 40 7329772
Email: jussi.loponen@fazer.com
Ms. Roberta Luppi
INRA
Rue de la Géraudière BP 71627
44316 NANTES CEDEX 3, FRANCE
Phone: +33 240675000
Fax: +33 240675025
Email: roberta.luppi@nantes.inra.fr
Dr. Edurne Simon Magro
University of the Basque Country
Paseo de la Universidad, 7
01006 VITORIA-GASTEIZ, SPAIN
Phone: +34 945-01 30 69
Fax: +34 945-01 30 14
Email: edurne.simon@ehu.es
Dr. Mª Carmen Mena Valverde
National Center of Biotechnology,
CSIC
28049 MADRID, SPAIN
Phone: +34 915854670
Fax: +34 915854506
Email: mcmena@cnb.csic.es
Ms. Kathryn Miller
Coeliac UK
3RD Floor, Apollo Center,
Desborough RD,
HIGHWYCOMBE
HPII 2QW, UK
Phone: +44 01494796130
Email: kathryn.miller@coeliac.org.uk
Dr. Luisa Novellino
Associazione Italiana Celiachia
Via Caffaro, 10
16124 GENOVA, ITALY
Phone: +39 010 8449406
Email: l.novellino@celiachia.it
Director Gavin O'Connor
European Commission,
Institute for Reference Materials and
Measurements,
Standards for Food Biosciences
Retieseweg 111
B-2440 GEEL, BELGIUM
Phone: +32 14 571812
Email: Gavin.O'CONNOR@ec.europa.eu
Dr. Lea Pollak
Croatian National Institute of
Public Health
Rockefellerova 7
10000 ZAGREB, CROATIA
Phone: +385 01048630266
Fax: +385 14863365
Email: lea.pollak@hzjz.hr
Mrs. Catherine Remillieux-Rast
Association Française des Intolérants
au Gluten (AFDIAG)
Rue de Venise 23
78740 VAUX-SUR-SEINE, FRANCE
Phone: +33 681270911
Fax: +33 130993668
Email: c.remillieux_rast@yahoo.fr
Mr. Nermin Sajic
EuroProxima B.V.
Beijerinckweg 18
6827 BN ARNHEM, THE
NETHERLANDS
Phone: +31 26 3630364
Fax: +31 263645111
Email: nermin.sajic@europroxima.com
Dr. Juan Ignacio Serrano-Vela
Asociacion de Celiacos de Madrid
Calle Lanuza 19-bajo
28028 MADRID, SPAIN
Phone: +34 917130147
Fax: +34 917258059
Email: nachoserrano@celiacosmadrid.org
Dr. Tuula Sontag-Strohm
Department of Food and Environmental
Sciences
University of Helsinki
Agnes Sjöbergin katu 2
P.O. Box 66
00014, HELSINKI, FINLAND
Phone: 358 9 19158230
Fax: +358 9 191 58475
Email: tsontag@mappi.helsinki.fi
Dr. Jean-Yves Thebaudin
GGF
Route de Thennes
80110 MOREUIL, FRANCE
Phone: +33 685949878
Fax: +33 322330561
Email: contact@c-viatis.com
Mrs. Pauline Titchener
Neogen Europe Ltd.
The Dairy School, Auchincruive
KA6 5HW AYR, SCOTLAND, UK
Phone: +44 1292 525 600
Fax: +44 1292 525 601
Email: p.titchener@neogeneurope.com
Dr. Thomas Weiss
R-Biopharm AG
An der neuen Bergstrasse 17
64297 DARMSTADT, GERMANY
Phone: +49 6151 8102 186
Fax: +49 6151 8102734
Email: t.weiss@r-biopharm.de
Mr. Johannes Wolf
Universitätsklinikum Leipzig A.ö.R.
Institut für Laboratoriumsmedizin,
Klinische Chemie und Molekulare
Diagnostik
Liebigstraße 27
04103 LEIPZIG, GERMANY
Phone: +49 341 97 22379
Fax: +49 341 97 22455
Email: johannes.wolf@medizin.unileipzig.de
Impressum
Proceedings of the 28th Meeting
WORKING GROUP
on PROLAMIN ANALYSIS and TOXICITY
September 25 - 27, 2014
Nantes, France
This work including all parts is subject to copyright. All rights are reserved and any
utilisation is only permitted under the provisions of the German Copyright Law.
Permissions for use must always be obtained from the publisher. This is in particular
valid for reproduction, translation, conversion to microfilm and for storage or
processing in electronic systems.
Scientific Organisation
Prof. Dr. Peter Koehler
Deutsche Forschungsanstalt für Lebensmittelchemie
Lise-Meitner-Str. 34, 85354 FREISING, GERMANY
Phone: +49 8161 712928; Fax: +49 8161 712970
Email: peter.koehler@tum.de
Host
Dr. Sandra Denery & Olivier Tranquet
INRA
Rue de la Géraudière BP 71627
44 316 Nantes Cedex 3, France
Phone: +33 2 40 67 50 27, Fax: +33 2 40 67 50 25
E-mail: olivier.tranquet@nantes.inra.fr
Cover picture and picture of participants
Thomas Mothes
© Verlag Deutsche Forschungsanstalt für Lebensmittelchemie (DFA)
Lise-Meitner-Strasse 34, 85354 Freising
Phone: +49 8161 712928; Fax: +49 8161 712970
dfa@lrz. tum.de / www.dfal.de
ISBN: 978-3-938896-92-1
|