Proceedings of the 26th Meeting
Working Group on Prolamin Analysis
and Toxicity (PWG)
Edited by Peter Koehler
German Research Centre for Food Chemistry, Freising
Verlag Deutsche Forschungsanstalt für Lebensmittelchemie - 2013
Preface
The 26th meeting of the Working Group on Prolamin Analysis and Toxicity (PWG) was held at Park Inn by Radisson, Leuven, Belgium from September 20 to 22, 2012. The PWG was hosted by the Leuven Food Science and Nutrition Research Centre (LFoRCe) and the Vlaamse Coeliakievereinigung (VCV). Inge Celus and Kurt Gebruers, the local organisers, were present during the entire meeting. Peter Koehler, chairman of the PWG, welcomed the group, the invited speakers, and the participants from industry (cereal starch producers, producers of gluten-free food, producers of kits for gluten analysis), research institutes as well as the delegates from international coeliac societies.
The PWG meeting aimed at continuing the discussion of results of analytical and clinical work done recently and also to provide current information regarding legal aspects of gluten labelling. This time special attention was laid on the importance of antibodies in relation to coeliac disease. A special symposium was held showing the progresses in the analytical as well as in the diagnostic use of antibodies. Although sometimes heavily attacked, antibodies remain an integral part of research related to coeliac disease and gluten detection.
I would like to express my thanks to all participants of the meeting for their active contributions and the discussions that resulted thereof. I am in particular grateful to Inge Celus and Kurt Gebruers from LFoRCe and VCV for their enthusiasm, which resulted in a perfectly organised meeting. Thanks also to my predecessor Martin Stern for giving advice on how to organise such a PWG meeting. Finally, I express my gratitude to all friends, colleagues, sponsors and participants for supporting the PWG by attending this meeting.
Freising, April, 2013 Peter Koehler
1. Executive Summary
The meeting focused on quantitative gluten analysis by immunological and instrumental methods, on the analytical and clinical use of antibodies, and on the legal situation concerning gluten labelling.
Analytical reports
The analytical session included eight reports, of which six were focussed on analytical methods for gluten quantitation. Beside ELISA also alternative methods were presented. One contribution specifically addressed the occurrence of coeliac disease active epitopes in oats. In the symposium new antibodies for the detection of prolamins and glutelins were described.
Clinical reports
Four reports were given in the clinical session that were focussed on the use of prolylendopeptidases to assist in gluten degradation in food, on the pathomechanism of coeliac disease, and on the coeliac toxicity of rye and barley prolamins. The second part of the symposium gave a comprehensive overview on coeliac disease diagnosis on the basis of different antibodies in the blood.
Legal aspects
In total three presentations addressed legal issues of gluten and gluten labelling. While Canada adopted the thresholds of the Codex Alimentarius and the EU the legal situation in the United States of America is still unclear. Finally, the activities of the EU legislation towards a common regulation, in which the current standard could be incorporated was commented by the starch industry and the Association of European Coeliac Societies (AOECS). The latter also provided information on proprietary methods in the Codex Alimentarius.
4. Analytical research reports
4.1 Progress and status of collaborative studies on gluten detection using ELISA kits
Clyde Don1, Theresa Schwalb2, Peter Koehler2
1 CDC Foodphysica, Driel, The Netherlands
2 German Research Centre for Food Chemistry, Freising, Germany
Introduction
The Protein & Enzymes Technical Committee of AACC International (AACCI) initiated two collaborative studies on gluten analysis with the R5 ELISA method, in close collaboration with the Prolamin Working Group (PWG). The analysis of intact gluten used the sandwich ELISA (RIDASCREEN Gliadin R7001), the analysis of hydrolysed gluten (fermented foods) used the R5 competitive ELISA (RIDASCREEN Gliadin competitive R7021). Based on the collaborative study reports [1,2], both R5 methods have recently been approved by the Approved Methods Technical Committee of AACC International. The ELISA method based on the G12 antibody is currently being investigated (pre-collaborative stage). This paper summarises the progress and conclusions of the inter-lab studies on gluten quantitation by ELISA that have been completed recently and are currently underway. The focus is laid on the recoveries and the limits of detection (LOD).
Materials and methods
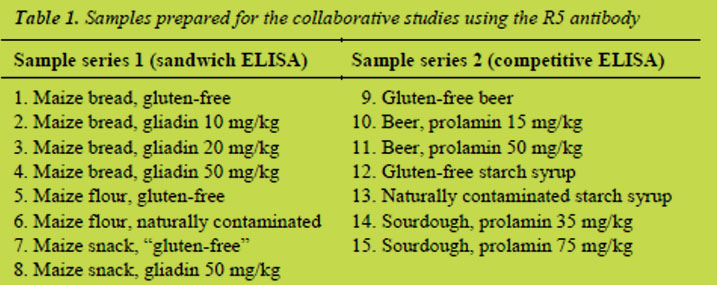
A previous PWG paper [3] describes the preparation, sampling and distribution of both sample sets for the sandwich R5 ELISA and the competitive R5 ELISA shown in Table 1. Briefly, series 1 contained non-hydrolysed gluten and was analysed with the sandwich ELISA, whereas in samples of series 2 partially hydrolysed gluten was present, which had to be analysed by the competitive ELISA. Samples for the G12 inter-lab study, which is currently carried out, are based on a rice flour mix (not shown).
Samples of series 1 were differently heat-treated. Maize flour was not heat-treated, bread was moderately heat-treated, and the extruded snack was more heavily processed. Bread and snack were based on gluten-free maize flour, to which wheat flour with a defined gliadin content (determined by HPLC) was added. The analyses showed that the “gluten-free” snack contained gluten contamination, probably coming from the production line. Samples of series 2 were differently prepared. Gluten-free beer made from sorghum was used as a base material, which was spiked to a defined prolamin concentration with a peptic-tryptic hordein digest [4]. Gluten-free maize starch syrup and contaminated wheat starch syrup were obtained from suppliers.
Contaminated sourdough was prepared by mixing dried, gluten-free quinoa sourdough and rye sourdough with a defined gluten content (determined by competitive R5 ELISA).
Labs followed instructions from AACCI Approved Methods, PWG and the leaflet of the test kit manufacturer for performing the analyses. Non-zero samples were calculated with software that came with the test kit (RIDA®SOFT Win Z9999). The zero samples and the LOD had to be calculated using polynomial regression models (Microsoft Excel).
Results and discussion
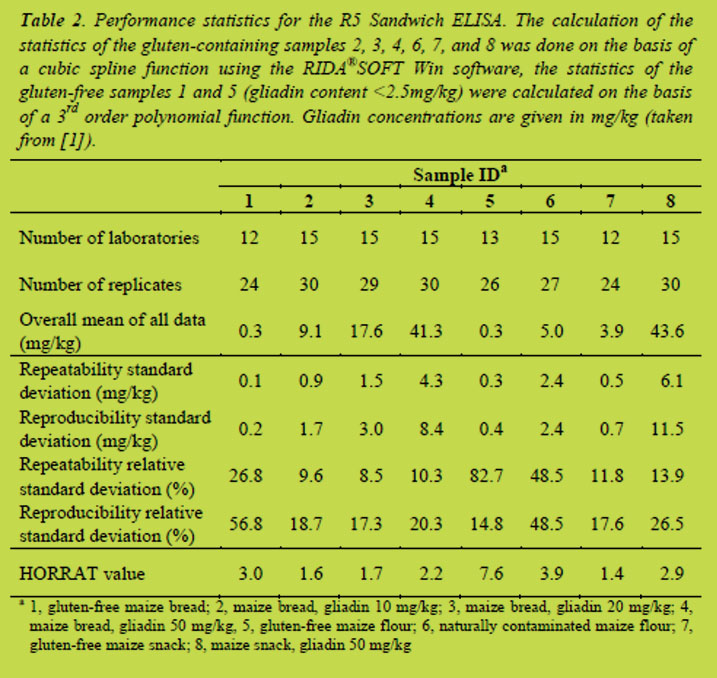
In the previous PWG paper [3] only the unprocessed raw data has been given. This paper reports the final results of both collaborative studies after statistical evaluation (Tables 2 and 3) including the results from the calculations of the LOD. No results are available yet from the validation of the G12 ELISA.
Recovery and LOD
R5 sandwich ELISA: Recoveries were calculated for samples with known gluten concentrations (samples 2, 3, 4, and 8) and were between 83 and 91%. Values for the LOD were determined for the zero samples 1 and 5 by multiplying the reproducibility standard deviations by 3.3. This resulted in values of 0.7 and 1.3 mg prolamin/kg corresponding to a mean LOD of the sandwich ELISA of 1 mg prolamin/kg.
Abbott et al. [5] have defined performance characteristics important for an allergen method. For samples with known concentrations of the allergen, recoveries should be between 80% and 120%. The recoveries of the sandwich ELISA ranged from 83% to 91% and, thus, fulfilled the criteria given in [5]. Furthermore, the LOD was well below the threshold for gluten-free foods of 20 mg gluten/kg showing that the R5 sandwich ELISA is sensitive enough for quantifying intact gluten in food.
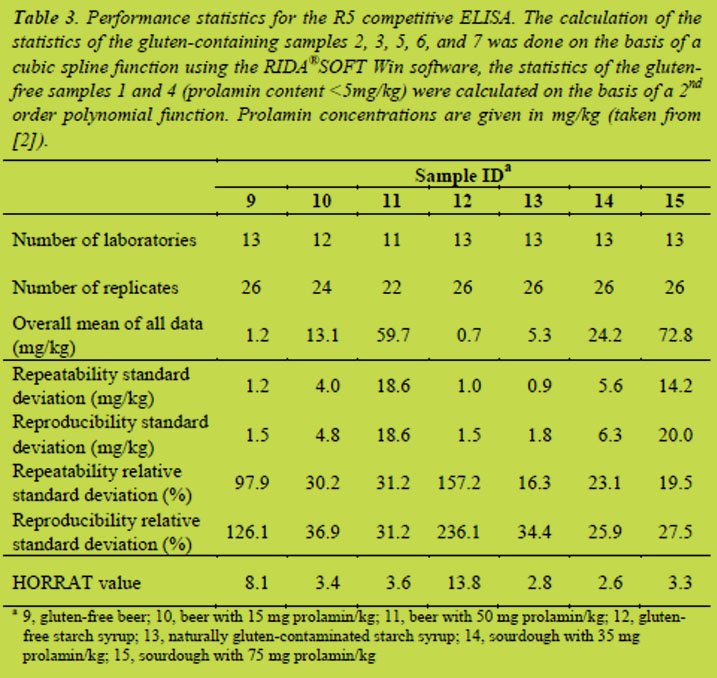
R5 competitive ELISA: Recoveries were calculated for samples with known gluten concentrations (samples 10, 11, 14, and 15). The recovery range for all samples was between 69 and 119 %, and for beer samples between 87 and 119%. Values for the LOD were calculated as described above by multiplying the reproducibility standard deviations of the zero samples 9 and 12 by 3.3. This gave a LOD of the competitive ELISA of 5 mg prolamin/kg.
For the beer samples the recoveries were inside the 80% - 120% range. The overall recovery range of the R5 competitive ELISA between 69% and 119% was somewhat outside of the preferred recoveries for an ELISA method (80 to 120%; [5]). On the other hand the guidelines given in [5] also state that in so-called ‘difficult matrices and samples’ recoveries between 50% and 150% can be tolerated. In this case the fermented product samples can be considered as difficult matrices in gluten analysis. The LOD of the R5 competitive ELISA was also higher compared to the sandwich ELISA. Nevertheless, the method still allows gluten detection below the threshold of 20 mg gluten/kg. More detailed discussions of calculations and evaluations of the results of the collaborative studies are published elsewhere [1,2].
Current status of gluten ELISA kits under evaluation
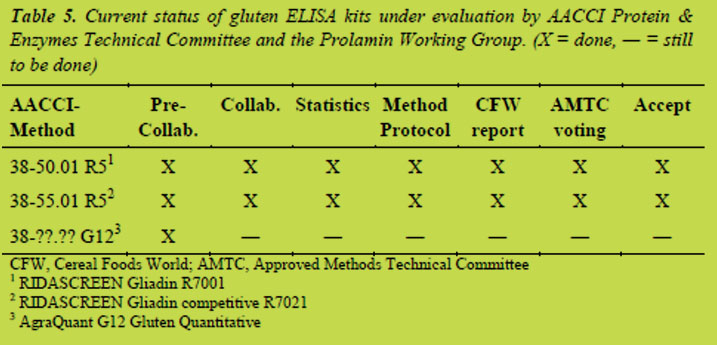
Table 5 summarises the status of the evaluation of gluten ELISA kits under the guidance of the AACCI Protein & Enzymes Technical Committee and the PWG. The validation work of the R5 ELISA is almost finished, and a collaborative study on the validation of the G12 ELISA has recently been started.
Conclusions
The validation work under supervision of the AACCI Protein & Enzymes Technical Committee and the PWG has resulted in the acceptance of two gluten detection methods, AACCI Approved Method 38-50.01 and 38-55.01. This is an important step forward in the validation of methods for the analysis of gluten-free foods. For a long time, reliable gluten detection and/or measurement below a concentration of 20 mg/kg has been assumed to be an analytical challenge. The extensive inter-lab studies performed so far show that modern ELISA kits are able to detect and quantify gluten concentrations in foods and beverages below the current Codex threshold of 20 mg gluten/kg.
Acknowledgements
The assistance of Markus Lacorn, Ulrike Immer and Sigrid Haas-Lauterbach is gratefully acknowledged. We also want to thank Michael Tilley for editorial advice and Paul Wehling for statistical support.
References
1. Koehler P, Schwalb T, Immer U, et al. AACCI Approved Methods Technical Committee Report: Collaborative study on the immunochemical determination of intact gluten using an R5 sandwich ELISA. Cereal Foods World 2013; 58: 36-40.
2. Koehler P, Schwalb T, Immer U, et al. AACCI Approved Methods Technical Committee Report: Collaborative Study on the Immunochemical Determination of Partially Hydrolyzed Gluten by an R5 Competitive ELISA. Cereal Foods World 2013; 58: doi:10.1094/CFW-58-03-0402.
3. Koehler P, Schwalb T, Don C. Collaborative study on gluten determination using sandwich and competitive R5 ELISA kits. In: Koehler P (ed): Proceedings of the 25th Meeting, Working Group on Prolamin Analysis and Toxicity. Verlag Deutsche Forschungsanstalt für Lebensmittelchemie, Freising, 2012; pp. 23-27.
4. Gessendorfer B, Wieser H, Koehler P. Preparation and characterization of enzymatically hydrolyzed prolamins from wheat, rye, and barley as references for the immunochemical quantitation of partially hydrolyzed gluten. Anal Bioanal Chem 2009; 395: 1721-1728
5. Abbott M, Hayward S, Ross W, et al. Validation procedures for quantitative food allergen ELISA methods: community guidance and best practices. J AOAC Int 2012; 93: 442-450, 2010.
4.2 Collaborative study on gliadin detection with the RIDASCREEN® gliadin and RIDASCREEN® gliadin competitive
Ulrike Immer1, Markus Lacorn1, Thomas Weiss1, Sigrid Haas-Lauterbach1
1R-Biopharm AG, Darmstadt, Germany
Introduction
The well-being of coeliac disease (CD) patients and individuals with gluten sensitivity depends on the avoidance of gluten in their daily diet. Clinical data suggest that products containing less than 20 mg of gluten proteins per kg food can be considered as safe for CD patients. Accordingly, the Codex Alimentarius Commission and many national legislations have introduced the term of “gluten-free” for products containing less than 20 mg/kg [1,2]. In order to control this threshold level, analytical methods are necessary both for producers of gluten-free food as well as for independent control laboratories.
The ELISA method using the R5 monoclonal antibody and the so called Cocktail extraction (overall named the R5 ELISA Méndez Method) is the generally accepted golden standard for gluten detection. The Cocktail solution as part of the Méndez Method contains denaturing and reducing agents, ensuring a very good recovery of gluten proteins also from heat-treated food. The R5 antibody recognises the amino acid sequence QQPFP and similar sequences present in prolamins from wheat, rye and barley. In contrast to other monoclonal antibodies mainly focussing on one target sequence from α2-gliadin (33-mer; [3]), the amino acid sequence QQPFP and similar sequences are present in many prolamins, including a wide range of toxic peptides, from wheat (including the 33-mer), rye and barley [4,5]. Prolamins are seen as the major source of toxic peptides, peptides derived from glutelins are considered as less toxic [4]. Since legislation requires the labelling of total gluten, the Codex Alimentarius recommends calculating total gluten content by multiplying the prolamin content with factor 2, which is also common practice for other detection methods. Thus, the R5 monoclonal antibody ensures a wide range of targets and a good detection of gluten proteins.
The R5 ELISA Méndez Method is endorsed as Type I method by the Codex Alimentarius and has also been granted the status of Official Method of Analysis 2012.01 (first action status) by the AOAC. These certificates are based on a collaborative study with the RIDASCREEN® Gliadin conducted in 2001 [6]. This sandwich ELISA is very well suited for the detection of entire (non-fragmented) prolamins. However, some food production processes can lead to the hydrolysis and thus fragmentation of prolamins e.g. those for beer, sourdough and syrup production. Since a sandwich ELISA relies on the binding of antibodies to at least two linked epitopes, small fragments with only one epitope escape detection in a sandwich format, but are well detectable in a competitive format. Thus, the RIDASCREEN® Gliadin competitive has been developed for the detection of fragmented prolamins.
In order to confirm the first collaborative study with the RIDASCREEN® Gliadin after more than a decade of successful gluten detection and to validate the newly developed RIDASCREEN® Gliadin competitive, a second collaborative study has been conducted in close collaboration with Clyde Don from the American Association of Cereal Chemists International (AACC) and Peter Koehler from the Prolamin Working Group following AACCI protocols. The results of this study will be presented in the following.
Materials and methods
Test kits
The RIDASCREEN® Gliadin R7001 from R-Biopharm AG is a 96 well sandwich ELISA. In addition to the antibody-coated microtiterplate, the test kit includes: test kit manual, quality assurance certificate, six standards (0; 5; 10; 20; 40 and 80 ng/mL gliadin), 11fold antibody conjugate, substrate and chromogen, stop reagent, 5fold sample buffer and 10fold wash buffer.
The RIDASCREEN® Gliadin competitive R7021 from R-Biopharm AG is a 96 well competitive ELISA. In addition to the antigen-coated microtiterplate, the test kit includes: test kit manual, quality assurance certificate, five standards (0; 10; 30; 90; and 270 ng/mL of a mixture of peptic-tryptic digested gliadin, secalin and hordein), 11fold antibody conjugate, substrate/chromogen, stop reagent, 5fold sample buffer and 10fold wash buffer.
Sample material
The following samples were prepared for the collaborative study of the RIDASCREEN® Gliadin R7001: (1) bread, gluten-free; (2) bread, containing gliadin at 10 mg/kg; (3) bread, containing gliadin at 20 mg/kg; (4) bread, containing gliadin at 50 mg/kg; (5) maize flour, gluten-free; (6) maize flour, naturally contaminated; (7) snack, gluten-free; (8) snack, containing gliadin at 50 mg/kg. These samples contained non-hydrolysed gliadin, which had been differently heat-treated during processing. Maize flour was not heat-treated, while the bread had been baked for 30 min at 230 °C. Snack samples were heavily heat-treated as they were produced in a pilot-scale twin-screw extruder at a barrel temperature of 170 °C (last stage). A detailed description of the sample preparation is given in [7].
The following samples were prepared for the collaborative study of the RIDASCREEN® Gliadin competitive R7021: (1) beer, gluten-free; (2) beer, containing hydrolysed hordein at 15 mg/kg; (3) beer, containing hydrolysed hordein at 50 mg/kg; (4) starch syrup, gluten-free; (5) starch syrup, naturally contaminated; (6) sourdough,containing hydrolysed secalin 35 mg/kg; (7) sourdough, containing hydrolysed secalin at 75 mg/kg. Hordein spiked into the beer samples was digested with pepsin and trypsin prior to spiking. A detailed description of the sample preparation is given in [8].
All samples were checked for homogeneity before they were bottled and accepted for the collaborative study.
Participating laboratories
Sixteen laboratories from Argentina, Austria, Belgium, Canada, Finland, Germany (2), Hungary, Ireland, Italy, New Zealand, Sweden, Switzerland, and the USA (3) participated in the testing of both test kits.
Sample presentation to the labs
Following the official instructions of the AACC International, two independent blinded replicates for each sample were presented to the participating laboratories. Thus, unknown duplicates for each sample were extracted and analysed in duplicate in one analytical run.
Sample workup
An assay protocol in AACC International style was provided for the sample preparation and labs had to follow the instructions. The general outline followed the kit manual, which is available from R-Biopharm AG upon request.
Assay protocol
An assay protocol in AACC International style was provided for the assay conduction and labs had to follow the instructions. The general outline followed the kit manual, which is available from R-Biopharm AG upon request. Moreover, it was described in which cases samples had to be repeated by further dilution and how dilutions had to be carried out.
Data calculation and statistics
Sample concentrations were calculated using the RIDA®SOFT Win software from R-Biopharm AG using a cubic spline function. Outliers were identified by using the Cochran and the Grubbs test according to AOAC guidelines [9].
Results and discussion
Table 1 shows the calculation according to AOAC guidelines for the RIDASCREEN® Gliadin (sandwich ELISA). The recovery of all spiked samples ranged from 83 to 91%. Gluten-free bread and maize flour were found below the limit of quantitation (LOQ; 2.5 mg/kg gliadin). The gluten-free snack was found to contain 3.9 mg/kg gliadin. This is probably due to a contamination during the production process. The snack was produced at a company commercially producing gluten-free food using the normal production equipment. However, from a legal point of view, the sample can still be labelled as gluten-free. Relative repeatability (RSD(r)) for the samples excluding the naturally contaminated maize flour ranged between 8.5 and 13.9%, which is an excellent value for a collaborative study. In comparison, the AOAC method 999.19 – Gliadin as a measure of gluten [10] the RSD(r) was between 13.6 and 25.5%. The relatively high RSD(r) of 48.5% for the naturally contaminated maize flour is due to the generally poor homogeneity of naturally contaminated samples and had already been identified during the homogeneity testing. Relative reproducibility (RSD(R)) ranged from 17.3 to 26.5% with the exception of the naturally contaminated sample with a value of 48.5%. The AOAC method 999.19 showed RSD(R) between 23.3 and 55.9%.
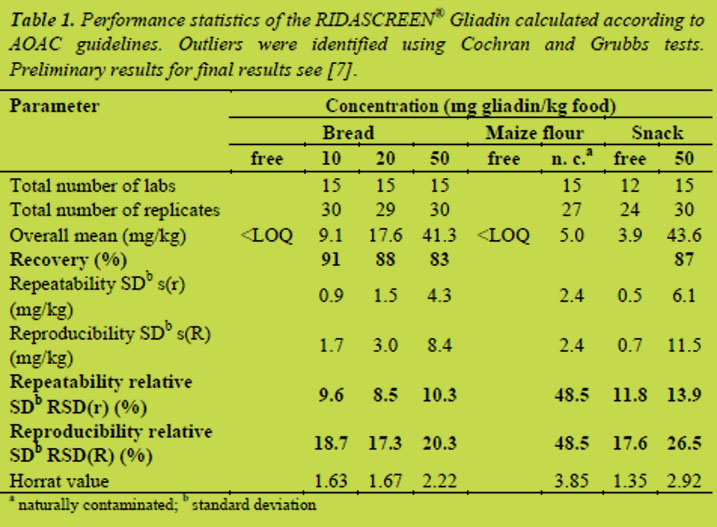
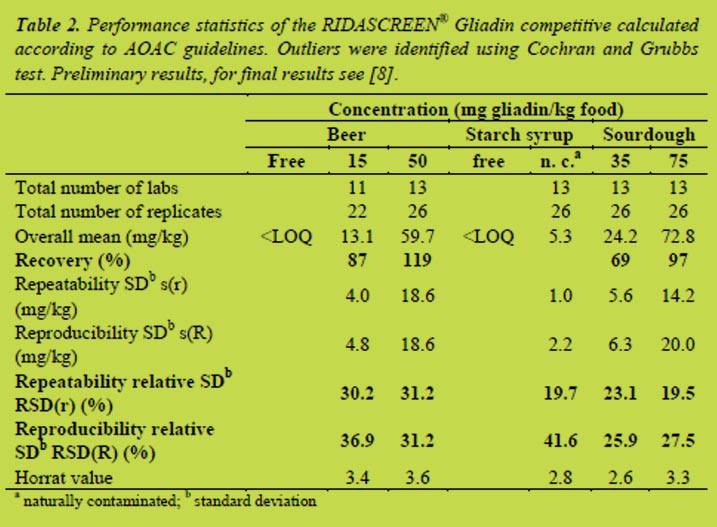
Table 2 shows the calculation according to AOAC guidelines for the RIDASCREEN® Gliadin competitive. The recovery of all spiked samples was between 69 and 119%. Gluten-free beer and starch syrup were found below the LOQ (5 mg/kg prolamin). Relative repeatability (RSD(r)) for the samples ranged from 19.5 to 31.2%, which is an expected value for a collaborative study. Relative reproducibility (RSD(R)) was between 25.9 and 41.6%. Again, the highest value was observed for the naturally contaminated sample. In general, sandwich ELISAs are very robust tests and are less susceptible to matrix effects or other influencing factors. It is, therefore, not surprisingly, that the competitive ELISA does not achieve the excellent levels of repeatability and reproducibility of the sandwich ELISA.
Conclusions
This collaborative study has shown that the RIDASCREEN® Gliadin (sandwich ELISA) based on the monoclonal R5 antibody is capable of analysing gliadin/gluten in foods with sufficient sensitivity and precision. Gliadin concentrations > 2.5 mg/kg can be quantitatively analysed. In the concentration range of most interest (10 mg gliadin/kg; 20 mg gluten/kg), where decision making on the outcome of the ELISA analysis is crucial in deciding whether a sample is gluten-free or not, the precision of the method is best. The collaborative study has also shown that heating of gliadin does not affect its extractability and its reactivity with the R5 antibody. Thus, the test has been repeatedly and successfully validated after 12 years on the market.
Furthermore, this collaborative study has shown that the RIDASCREEN® Gliadin competitive also based on the monoclonal R5 antibody is capable of analysing hydrolysed gliadin/gluten in foods with sufficient sensitivity and precision. Hydrolysed prolamin can be quantitatively analysed in concentrations > 5 mg/kg.
Data and text in this publication are partly taken from [7,8].
References
1. Codex Stan 118 – 1979. Codex standard for foods for special dietary use for persons intolerant to gluten. Adopted 1979, amended 1983, revised 2008
2. Commission Regulation (EC) No 41/2009 of 20 January 2009 concerning the composition and labelling of foodstuffs suitable for people intolerant to gluten
3. Shan L, Molberg Ø, Parrot I, et al. Structural basis for gluten intolerance in celiac sprue. Science 2002; 297: 2275-2279
4. Tye-Din JA, Stewart JA, Dromey JA, et al. Comprehensive, quantitative mapping of T cell epitopes in gluten in celiac disease. Sci Translat Med 2010; 41: 1-14
5. Kahlenberg F, Sanchez D, Lachmann I, et al. Monoclonal antibody R5 for detection of putative coeliac-toxic gliadin peptides. Eur Food Res Technol 2006 222; 78-82
6. Méndez E, Vela C, Immer U, et al. Report of a collaborative trial to investigate the performance of the R5 enzyme linked immunoassay to determine gliadin in gluten-free food. Eur J Gastroenterol Hepatol 2005, 17: 1053-1063
7. Koehler P, Schwalb T, Immer U, et al. AACCI Approved Methods Technical Committee Report: Collaborative study on the immunochemical determination of intact gluten using an R5 sandwich ELISA. Cereal Foods World 2013; 58: 36-40.
8. Koehler P, Schwalb T, Immer U, et al. AACCI Approved Methods Technical Committee Report: Collaborative Study on the Immunochemical Determination of Partially Hydrolyzed Gluten by an R5 Competitive ELISA. Cereal Foods World 2013; 58: doi:10.1094/CFW-58-03-0402.
9. AOAC International, Appendix D: Guideline for collaborative study procedures to validate characteristics of a method of analysis. AOAC Official methods of analysis 2002.
10. AOAC Official Method 991.19 Gliadin as a Measure of Gluten in Foods Colorimetric Monoclonal Antibody Enzyme Immunoassay Method.
4.3 Detection of gluten utilising next generation monoclonal antibody G12
Elisabeth Halbmayr-Jech1, Lukas Frank1, Adrian Rogers2
1 Romer Labs Division Holding GmbH, Technopark 1, 3430 Tulln, Austria
2 Romer Labs UK ltd, The Heath Business and Technical Park Runcorn, Chesire WA7 4QX, United Kingdom
Introduction
Approximately 1% of the world’s population is affected by coeliac disease (CD) - an immune-mediated enteropathy caused by the ingestion of gluten proteins. CD is a genetically predisposed auto-immune disorder, in which the immune system responds inappropriately to dietary gluten [1]. The majority of proteins responsible for such an immune reaction are prolamins. The strongest response is directed towards an α2-gliadin fragment that is 33 amino acids long and a principal contributor to gluten immunotoxicity [2]. This so-called 33-mer with peptide structure of LQLQPFPQPQLPYPQPQLPYPQPQLPYPQPQPF is highly resistant to breakdown by digestive enzymes [2,3] and is, therefore, a suitable molecule for use as an analytical marker. Homologues have been found in food grains that are toxic for coeliac patients, but are not present in safe grains [2]. The monoclonal G12 antibody specifically recognises the 33-mer of the gliadin protein present in gluten and detects the hexapeptide sequence QPQLPY and similar peptides found in barley, rye and some oats [4,5].
The only effective treatment for CD up to now has been a lifelong gluten-free diet. For defining “gluten free” the Codex Alimentarius Committee published the 2008 CODEX Standard for Foods for Special Dietary Use for Persons Intolerant to Gluten (CODEX STAN 118 – 1979) [6] mentioning the use of immunologic methods utilising antibodies that should react with the cereal protein fractions that are toxic for persons intolerant to gluten. Food labelled as gluten-free must not exceed 20 mg/kg gluten, whereas food containing low levels of gluten has to be lower than 100 mg/kg gluten. This recommendation concerning thresholds was taken into European legislation through Commission Regulation (EC) No 41/2009 of 20 January 2009, concerning the composition and labelling of foodstuffs suitable for people intolerant to gluten [7]. A proposed rule for gluten-free labelling of foods is in preparation in the U.S..
There is an on-going debate whether oats are safe. Several publications conclude that certain oat varieties may cause an auto-immune response in coeliac patients [8]. Therefore, the G12 antibody may shed new light on this debate by recognising oat varieties that trigger a response in coeliac patients. In vitro studies showed correlation of the reactivity of the G12 antibody with the immunogenicity of prolamin extracts from different oat varieties [5,9].
Several analytical methods such as antibody based immunological assays, polymerase chain reaction (PCR) methods and newer concepts like mass spectrometry are available - all with varying degrees of commercialisation and showing advantages and disadvantages [10]. Current clinical opinion favors an analytical test system that is able to detect epitopes that are important in CD.
Therefore, to enhance food safety and the correct labelling of gluten-free food, a new sandwich ELISA assay and LFD employing the monoclonal G12 antibody were developed and characterised in this study.
Materials and Methods
Enzyme-linked immunosorbent assay
Test Kit: The AgraQuant® Gluten G12 (COKAL0200, Romer Labs UK Ltd.) is a 96 well sandwich ELISA test kit which includes the following items: package insert, certificate of performance, 5 standards (0, 4, 20, 80, 200 mg/kg gluten) calibrated against PWG-gliadin [11,12], Gluten G12 antibody coated microwells, ready-to-use extraction solution, 5x concentrated dilution buffer, 10x concentrated wash buffer, ready-to-use conjugate, ready-to-use substrate, ready-to-use stop solution and 1 sachet of fish gelatin. The ELISA’s limit of detection (LOD) is 2 mg/kg gluten with a quantitation range from 4-200 mg/kg gluten.
Methodology: From a 5 g of homogenised sample, a 0.25 g portion was taken and added to 2.5 mL of extraction buffer and mixed well. The extract was incubated at 50°C for 40 min, allowed to cool before adding 80% ethanol and mixing well. Extracts were then shaken for one hour at room temperature (RT) using a rotator. The extracts were centrifuged at 2000 x g in order to obtain a clear aqueous layer (filtered if necessary) and the supernatant diluted 1:10 with pre-diluted sample dilution buffer. The sample extract was then ready for testing. 100 μL of each ready-to-use standard or prepared sample were transferred into the corresponding antibody coated microwells and incubated for 20 min at RT. Plates were washed 5 times and dried before 100 μL of conjugate were dispensed into each well and incubated for 20 min at RT. Plates were washed 5 times and dried before 100 μL of the substrate was pipetted into each microwell and incubated at RT for 20 min. 100 μL of stop solution were dispensed into each microwell before reading with a microwell reader using a 450 nm filter.
Lateral Flow Device
Test Kit: AgraStrip® Gluten G12 (COKAL0200AS, Romer Labs UK Ltd) is a lateral flow device which includes the following items: tube containing 10 strips, extraction buffer, dilution buffer, extraction tubes (with caps and dropper tips), breakpoint swabs.
Methodology: When testing solid samples, 0.2 g of homogenised sample were added to an empty extraction tube and the tube was filled with extraction buffer to the indicated level. After closing the tube with the cap, the sample was extracted by shaking vigorously by hand for 1 min. The cap was exchanged with a dropper tip and 3 drops (100 μL) are transferred into another extraction tube containing 20 drops (800 μL) of dilution buffer. This tube was shaken for 15 s and afterwards the AgraStrip® Gluten G12 LFD was placed vertically into the extraction tube. After the liquid has reached the indicated flow level, which took about 45 s, the test strip was removed and placed upright into the holder provided. After 10 min development the result was read immediately. One single blue line in the central part of the strips indicated a negative result whereas one red and one blue line showed a positive result.
Samples
The tested food samples were purchased at local supermarkets and were both commercially prepared and naturally gluten-free products. Grain samples were sourced in UK with exception of an oat sample from Spain. Also, proficiency samples from previous FAPAS rounds were analysed. FAPAS round 2792 was infant soy formula and round 2795 was cake mix with one gluten containing and one gluten-free sample each. All samples were extracted and analysed according to the procedure described above.
Spike recovery
A spiking solution was prepared from vital wheat gluten (VWG), extracted in 60% ethanol and calibrated against the PWG standard [12]. Samples were fortified with spiking solution at a concentration of 0.5 mg VWG/mL to provide levels of 5 or 10 mg/kg gluten in the samples. The spike was added to the weighted sample then left at RT for 30 min before extraction.
Study design
All samples were extracted and analysed according to the standard procedure. Cross-reactivity and specificity studies on a range of food matrices using the AgraQuant® Gluten G12 ELISA and the AgraStrip® Gluten G12 LFD were conducted. The AgraQuant® Gluten G12 ELISA was employed to analyse incurred food samples and proficiency samples from previous FAPAS rounds. Spiking experiments were conducted and the kit’s performance was compared with a Gluten ELISA utilising R5 antibody. The LOD of the AgraStrip® Gluten G12 was determined with spiking experiment of different commodities. Testing of rinse water was performed in order to assess influence of pH value. In addition, swabbing experiments from stainless steel and plastic were conducted to determine recovery from surfaces.
Results and Discussion
Different food matrices like nuts, oils, seeds and starches were analysed and no cross-reactivity could be observed. In Table 1, the results for the AgraQuant® Gluten G12 ELISA and the AgraStrip® Gluten G12 LFD are shown to correlate very well. It was confirmed during these studies that both G12 test kits do not give any false positive signals with soy and they are, therefore, suitable for measuring gluten in products
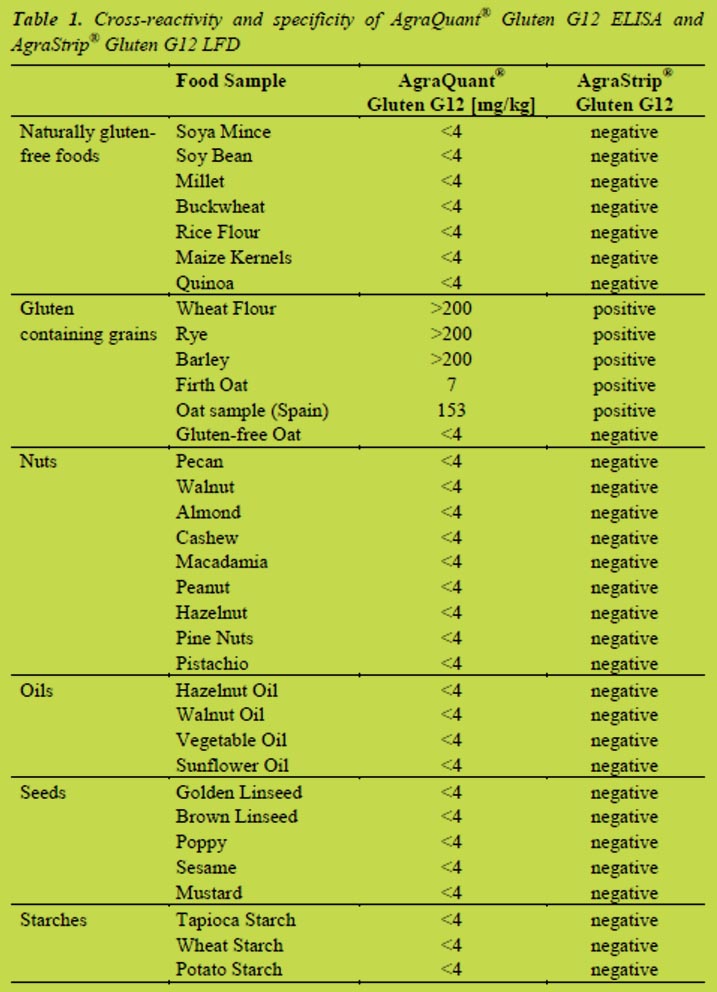
containing soy. There is also no cross-reactivity to maize or rice. During the analysis of wheat, barley and rye samples strong responses above the assay’s upper limit of quantitation (LOQ) of 200 mg/kg gluten were obtained. Also, for some oat varieties positive signals were observed, which is in line with published literature on the G12 antibody that it is capable of detecting potentially immunotoxic varieties [9].
Table 2 shows when testing incurred food samples labelled as gluten-free including cookies, cakes, bread, muffins etc., and all results were below the lower LOQ of 4 mg/kg gluten with the exception of “Honey and Oat Cookies”. This positive result may be due to contamination during production of the cookies or maybe a positive reaction to the oat variety used. Table 2 also shows some typical results of the comparison of the G12 ELISA with an R5 ELISA. Several samples labelled as gluten-free were analysed and spiking experiments were conducted. This data showed that the two methods give very comparable results for the sample types tested.
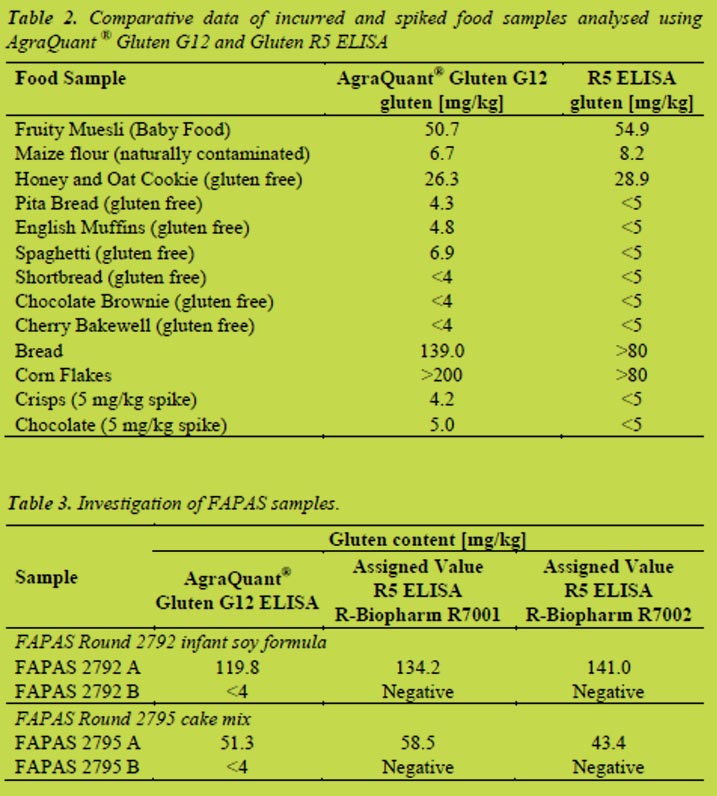
In addition, proficiency samples from previous FAPAS rounds were investigated (results are displayed in Table 3). Results of the AgraQuant® Gluten G12 ELISA were similar to the assigned values for the R-Biopharm Gluten R5 ELISA kits.
AgraStrip® Gluten G12 LFD was used in a spiking experiment with various commodities such as yoghurt, dairy free spread, chocolate, curry sauce and rice flour. The test strip was able to detect 5 mg/kg gluten in all commodities except for chocolate were the LOD was determined to be 10 mg/kg gluten. Comparison with another commercially available Gluten LFD resulted in LODs greater than 10 mg/kg gluten in the commodities tested. Results are shown in Table 4.

When testing rinse water with the Gluten G12 LFD there was no influence on results within pH of 5 to 9 (data not shown). Swabbing experiments from stainless steel and plastic showed that it is possible to recover 4 mg gluten from both surfaces (data not shown).
Conclusions
It has been demonstrated that the AgraQuant® Gluten G12 sandwich ELISA and the AgraStrip® Gluten G12 LFD - both employing the monoclonal G12 antibody - gave very promising results for the analysis of gluten across a range of different samples. As the methods target the 33-mer from α2 gliadin, which was identified to be the principal contributor to gluten immunotoxicity [2], methods based on the G12 antibody are an attractive approach for improving gluten detection. The performance of both methods needs to be evaluated by running collaborative trials.
References
1. Hischenhuber C, Crevel R, Jarry B, et al. Review article: safe amounts of gluten for patients with wheat allergy or coeliac disease. Aliment Pharmacol Ther 2005, 23: 559-575.
2. Shan L, Molberg Ø, Parrot I, et al. Structural basis for gluten intolerance in celiac sprue. Science 2002, 297: 2275-2279.
3. Comino I, Real A, Vivas S, et al. Monitoring of gluten-free diet compliance in celiac patients by assessment of gliadin 33-mer equivalent in feces. Am J Clin Nutr 2012, doi: 10.3945/ajcn.111.026708.
4. Morón B, Bethune MT, Comino I, et al. Toward the assessment of food toxicity for celiac patients: Characterization of monoclonal antibodies to a main immunogenic gluten peptide. PLoS ONE 2008, 3(5): e2294.
5. Morón B, Cebolla A, Manyani H, et al. Sensitive detection of cereal fractions that are toxic to celiac patients by using monoclonal antibodies to a main immunogenic wheat peptide. Am J Clin Nutr 2008, 87: 405-414.
6. Codex Alimentarius Commission, Codex Standard 118-1979 2008, Rome, Italy
7. EC Commission Regulation No. 41/2009, 2009, Brussels, Belgium
8. Arentz-Hansen H, Fleckenstein B, Molberg Ø, et al. The molecular basis for oat intolerance in patients with celiac disease. PLoS ONE 2004, 1(1): e1.
9. Comino I, Real A, De Lorenzo L, et al. Diversity in oat potential immunogenicity: basis for the selection of oat varieties with no toxicity in coeliac disease. Gut 2011, 60: 915-922.
10. Diaz-Amigo C, Popping B. Gluten - current status and new analytical developments in support of the regulatory requirements. J AOAC Int 2012, 95 (2): 335-336.
11. Halbmayr-Jech E, Hammer E, Fielder R, et al. Characterization of G12 sandwich ELISA, a next-generation immunoassay for gluten toxicity. J AOAC Int 2012, 95 (2): 372-376.
12. Van Eckert R, Berghofer E, Ciclitira PJ, et al. Towards a new gliadin reference material-isolation and characterisation. J Cereal Sci 2006, 43: 331-341.
4.4 Analysis of gluten in human milk samples in coeliac and non-coeliac mothers
María C. Mena1, Manuel Lombardía1, María Roca2, Carmen Ribes-Koninckx2, Juan P. Albar1
1 Proteomics Facility, Centro Nacional de Biotecnología, Consejo Superior de Investigaciones Científicas, Madrid, Spain
2 Pediatric Gastrohepatology Unit, La Fe Hospital, Valencia, Spain
Introduction
Breastfeeding has several beneficial effects both for the child and the mother. A positive effect in coeliac disease (CD) has been reported although it is not completely understood whether there is a diminished incidence of the disease or only a delay in onset of symptoms. The international recommendation is to maintain breastfeeding at and beyond the time of gluten introduction, that must be done in little progressive amounts into the diet of the baby. In addition, it would be desirable to continue breastfeeding at least during two to three months more after the introduction of gluten in the diet [1]. Furthermore, this introduction must be done not before the fourth month and not after the seventh. The mechanisms underlying breastfeeding benefits in CD are not clear but several hypotheses support these effects. Breastfeeding contributes to the optimal development of immune system of new-borns. Breastfed infants have a different intestinal microbiota composition comparing with formula fed children, having this fact an influence in the risk of developing CD [2]. In addition, the delay in cow´s milk introduction in the diet could diminish the appearance of allergies and/or intolerances. Furthermore, the optimal development of immune system contributes to the decreasing in the incidence and/or severity of a wide range of infectious diseases such as those for rotavirus that seem to have a relationship with CD.
Together to these hypotheses, other theories could explain the role of breastfeeding in CD. The possible amounts of gluten present in human milk samples [3,4] could promote an oral tolerance against gluten in the new-born, diminishing the negative effect of gluten ingestion in genetically susceptible individuals for CD. Nevertheless, in coeliac mothers on a gluten-free diet, this effect would not appear if there is no gluten in their human milk. Taking into account these hypotheses it is very interesting to quantify the gluten content in human milk and the variations along different stages of lactation and between coeliac and non-coeliac mothers.
The aim of this study is to quantify the presence of gluten in human milk samples using the more sensitive and specific techniques.
Material and methods
We analysed human mature milk samples in healthy mothers on a normal diet and coeliac mothers following a gluten-free diet. Samples were taken in different moments along the breastfeeding period from one up to fourteen months of lactation. Samples were expressed using a pump after feeding the baby and were frozen at -20º C at home until the delivery in cold conditions to the laboratory.
Samples were analysed using the sandwich and competitive R5 ELISA. For both assays samples were analysed more concentrated than the usual dilution used for analysis of gluten-free foods as, based in previous literature [3,4], the expected amount of gluten in human milk samples is lower (ng/mL) compared to gluten-free foods (μg/mL).
We used a homemade sandwich R5 ELISA [5,6] and a competitive R5 ELISA [7] both based on the unique monoclonal antibody R5. This antibody reacts with the epitope QQPFP and other amino acid motifs such as QLPFP, LQPFP and QQQFP present in coeliac-toxic sequences [8,9] from gliadins, hordeins and secalins; the antibody was found to be highly sensitive towards these prolamins [6].
We analysed human milk samples spiked with a known amount of gliadins and we compared them with the control (gliadins in PBS-tween 0.05%-BSA 1% Buffer) to test the recovery of gliadins and to discard that positive results are due to interference components of the samples considering that very low dilutions are used for these samples.
The analysis of R5 western blot was also performed. After one-dimensional SDS-PAGE, proteins were electrotransferred onto polyvinylidene difluoride membranes, incubated with R5-HRP and immunodetected using enhanced chemiluminescence (GE HealthCare), as previously described [6].
For the mass spectrometry (MS) analysis by ESI-IT and MALDI-TOF/TOF, samples were first digested with modified porcine trypsin (sequencing grade, Promega, Madison WI, V5111). NanoLC ESI-IT MS/MS system analyses were performed on an Ultimate 3000 nanoHPLC (Dionex, Sunnyvale, California) coupled to an HCT Ultra IT mass spectrometer (Bruker Daltonics, Bremen, Germany). A full scan MS analysis was performed and then the most abundant ions were isolated for CID fragmentation. Raw LC-MS data were processed using the DataAnalysis 3.4 software (Bruker Daltonics, Bremen, Germany). For MALDI-TOF/TOF analyses of the samples, mass spectra were acquired automatically in positive ion reflector mode using an ABi 4800 MALDI-TOF/TOF mass spectrometer (AB Sciex, MA, USA). For protein identification, LC ESI-IT and MALDI-TOF/TOF MS/MS spectra were searched against the National Center for Biotechnology Information (NCBI) database using a licensed version of Mascot v.2.3.02. (www.matrixscience.com; Matrix Science, London, UK) as search engine.
Results and discussion
The competitive R5 ELISA analysis of one sample of whey fraction of human milk yielded a positive result while the Sandwich analysis result was negative (below the quantification limit) (Table 1). The results of the spiked sample suggest that some ingredients found in milk could interfere with the ELISA analysis as using the competitive system the results are overestimated while using the sandwich they are underestimated (Table 1.)

Several factors can contribute to the negative result found when using the sandwich ELISA: (a) gliadins present in human milk are highly hydrolysed or even deamidated and it is not possible to completely quantify them using a Sandwich based ELISA, (b) gliadins are present in fragments of enough length to be detected by the sandwich system but they are present in a lower concentration than the limit of quantification of the technique, (c) gliadins are not detected due to the interference components present in human milk.
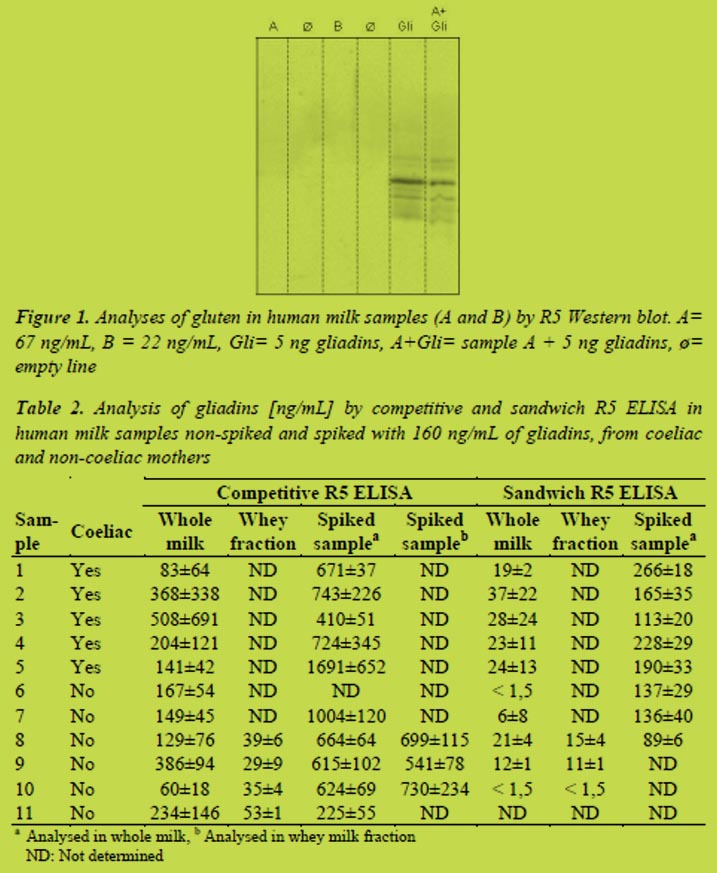
Western blot R5 analysis was performed to confirm the presence of gliadins. For this purpose and to achieve a high sensitivity, a high sample concentration was performed. Human milk contains a great amount of proteins and therefore it is necessary to remove the major proteins without losing gliadins using precipitation with 60% ethanol. We observed the typical reactive gliadins bands in both controls but not in human milk samples (Figure 1). This suggest that the positive values obtained using competitive R5 ELISA are false positives or, at least, they are highly overestimated, or the gluten proteins present in the milk are highly hydrolysed and cannot be detected by western blot. The R5 western blot does not detect any other protein in human milk samples and it suggests that the R5 antibody is not presenting cross-reactions with other proteins present in human milk.
In Table 2 the results of the analysis of human milk samples from coeliac and non-coeliac mothers by competitive and sandwich R5 ELISA are presented. We observed a huge variability in results comparing whole milk and the whey milk fraction and also between different assays (high standard deviation value). There is a slighter less variability when analysing the whey fraction of human milk. Taking into account our previous results explained above, it is necessary to confirm that these data are not due to interferences or false positives. The R5 western blot analysis (data not shown) at the conventional conditions was not useful to confirm the results.
We tried to confirm by non-immunological techniques that results found are due to the presence of gluten and not to interferences or false positives. Using MALDI-TOF/TOF and nanoLC- ESI Ion trap MS techniques we detected several proteins from wheat and barley in human milk but tryptic peptides found were not the usual for prolamins. The main difficulty when applying these types of techniques is the high number and the high dynamic range of proteins found in these samples. Recent proteomic studies on composition of human milk samples have demonstrated that up to 976 different human proteins can be identified in human milk [10]. Even though we tried to precipitate the major proteins of human milk they still remained in a high amount being this fact a limiting factor to identify minor proteins such as prolamins.
Conclusion
The overall conclusion is that results are not completely reliable and further research on the matter is needed, studying the components that are interfering in the analysis, as well as the responsible mechanism of the possible amount of gluten secreted by the mammary glandule.
In further studies we will (a) optimise the western blot technique to confirm that positive values found in some human milk samples are due to the presence of gluten, (b) analyse the content of gluten in human milk samples by sensitive proteomic techniques by using advanced instruments for in deep analysis with high accuracy, high fragmentation speed and high resolution features like the TripleTOF 56000 ABSciex coupled to nano LC system, and (c) quantify the possible presence of gluten in a representative number of human milk samples from coeliac and non-coeliac mothers.
References
1. Ludvigsson JF, Fasano A. Timing of introduction of gluten and celiac disease risk. Ann nutr metab 2012; 60 Suppl 2: 22-29.
2. Palma GD, Capilla A, Nova E, et al. Influence of milk-feeding type and genetic risk of developing coeliac disease on intestinal microbiota of infants: the PROFICEL study. PLoS ONE 2012; 7: e30791.
3. Chirdo FG, Rumbo M, Anon MC, et al. Presence of high levels of non-degraded gliadin in breast milk from healthy mothers. Scand J Gastroenterol 1998; 33: 1186-1192.
4. Troncone R, Scarcella A, Donatiello A, et al. Passage of gliadin into human breast milk. Acta Paediatr Scand 1987; 76: 453-456.
5. Mendez E, Vela C, Immer U, et al. Report of a collaborative trial to investigate the performance of the R5 enzyme linked immunoassay to determine gliadin in gluten-free food. Eur J Gastroenterol Hepatol 2005; 17: 1053-1063.
6. Valdes I, Garcia E, Llorente M, et al. Innovative approach to low-level gluten determination in foods using a novel sandwich enzyme-linked immunosorbent assay protocol. Eur J Gastroenterol Hepatol. 2003; 15: 465-474.
7. Mena MC, Lombardia M, Hernando A, et al. Comprehensive analysis of gluten in processed foods using a new extraction method and a competitive ELISA based on the R5 antibody. Talanta 2012; 91: 33-40.
8. Kahlenberg F, Sanchez D, Lachmann I, et al. Monoclonal antibody R5 for detection of putatively coeliac-toxic gliadin peptides. Eur Food Res Technol 2006; 222: 78-82.
9. Osman AA, Uhlig HH, Valdes I, et al. A monoclonal antibody that recognizes a potential coeliac-toxic repetitive pentapeptide epitope in gliadins. Eur J Gastroenterol Hepatol 2001; 13: 1189-1193.
10. Gao X, McMahon RJ, Woo JG, et al. Temporal changes in milk proteomes reveal developing milk functions. J Proteome Res 2012; 11: 3897-3907.
4.5 Measuring gluten in commercial soluble gluten ingredients
Päivi Kanerva1, Outi Brinck, Jussi Loponen, Tuula Sontag-Strohm, Hannu Salovaara
1 Department of Food and Environmental Sciences, University of Helsinki, Finland
Introduction
Addition of gluten proteins to originally gluten-free food products and other eatable applications, such as medicine, unreasonably makes the compliance to gluten-free diet more difficult. Gluten proteins have several characteristics that favour their use in various applications. First, the price is low since high amounts of gluten are produced as a side product in wheat starch industry. Second, gluten is a source of plant protein, which favours its use in vegetarian or vegan diets as well as in other diets in which proteins of animal origin need to be substituted. Gluten provides a noteworthy alternative to soy.
Intact gluten proteins have a very low solubility to water. However, both enzymatic and chemical methods have been developed to increase the solubility of gluten. An increase in the solubility by enzymatic methods can be achieved by hydrolysis [1,2] or by deamidation using protein-glutaminase or transglutaminase enzymes [3,4]. Chemical methods include deamidation in acidic or basic conditions [5]. Deamidation reaction involves a switch of an amide group of glutamine or asparagine to a hydroxyl group. This increases the solubility of gluten as the negative net charge is increased. Both enzymatic and chemical methods improve also the foaming and emulsifying properties of gluten.
The safety of gluten-free products is ensured by tests based on gluten-detecting antibodies. The antibodies have been raised against native gluten proteins and may not have similar reactivity with proteins with modified structures. Especially deamidation made by acid treatment decreased substantially the antibody recognition of gluten proteins [6]. However, due to the harshness of the acid treatment, enzymatic methods are more preferred in preparation of modified gluten for food-use.
There are two ELISA methods for measuring gluten contents in foods. The competitive technique has been developed to measure gluten content in products that contain hydrolysed proteins and peptides, whereas the sandwich method is more suitable for proteins with higher molecular weights. However, it is not always clear which technique, sandwich or competitive should be chosen. A product might contain small peptides, which are only detected by a competitive technique, together with larger proteins, which need more effective extraction conditions that are not compatible with the competitive technique. In either case, some of the harmful proteins or peptides go undetected.
The aim was to investigate whether gluten content can be measured accurately from commercial soluble gluten ingredients. In addition, we studied how treatment with protein-glutaminase affects the reactivity of gluten proteins with antibodies.
Materials and methods
Gluten samples
We had six different gluten samples included in this study. Samples included two vital wheat gluten samples kindly provided by Raisio plc. (Finland) and Kröner Stärke (Germany), one denatured gluten (Kröner Stärke, Gemany), and three soluble gluten samples (Tereos Syral, Belgium). One of the soluble gluten samples was a physically extracted fraction from wheat gluten, whereas two others were enzymatically hydrolysed wheat gluten.
Treatment with protein-glutaminase
Microbial protein glutaminase (PG) is a novel enzyme, which is able to selectively deamidate glutamine residues but does not crosslink or hydrolyse. Vital gluten was treated with the PG in ratio 4:1 in sodium phosphate buffer (pH 7) for 1, 3, 5, 17 and 30 h. The samples were freeze-dried for further analysis.
Analysis of protein contents and compositions
Samples were extracted with water, 60% ethanol, the cocktail solution (R7006, R-Biopharm, Germany) or 0.05 mol/L acetic acid. Ethanol and cocktail extractions were performed as advised in the ELISA protocols. Water and acetic acid extractions were performed either overnight at room temperature or 30 min at 50 ⁰C.
Degree of deamidation was measured by K-AMIA 11/05 -method (Megazyme, Ireland). The degree was calculated using following equation and Raisio vital gluten as a reference:

Soluble protein contents were analysed using a Lowry method (BioRad Laboratories, USA). The Gliadin standard of Prolamin Working Group (PWG Gliadin) was used as a reference material.
Gluten samples were analysed using a sandwich and competitive R5 ELISA methods following the instruction of manufacturer (R7001 and R7021, R-Biopharm, Germany).
Results and discussion
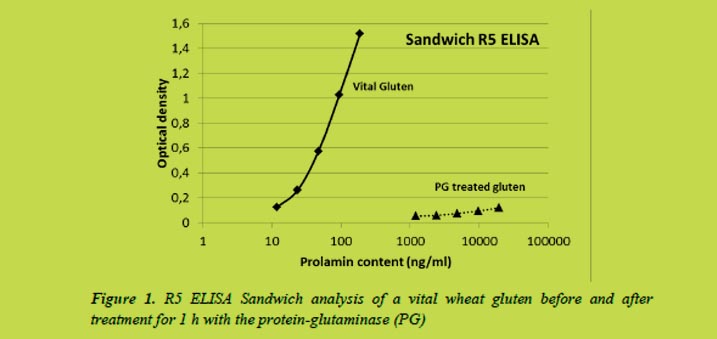
We found that the treatment with a microbial protein-glutaminase destroyed the reactivity between gluten proteins and antibodies already after 1 h treatment (Figure 1). The deamidation degree was 26%. No absorbance could be measured after longer treatment times as the deamidation degree increased to 54% in 30 hours.
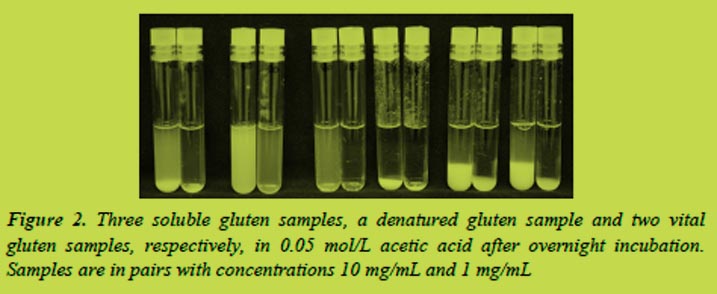
Instead of total solubility, gluten samples appeared as suspensions in 0.05 mol/L acetic acid solutions (Figure 2). Visible appearance of acid solubility was comparable to that of water. Soluble gluten samples made homogeneous suspensions in acetic acid whereas denatured gluten and vital gluten samples settled into two phases. Some separation was also observed in the first soluble gluten sample which contained proteins with similar molecular size than vital gluten samples.
Varying amounts of gluten proteins were extracted by different solvents (Figure 3). The cocktail solution was the most efficient solvent when extracting proteins from the vital gluten samples and especially when extracting proteins from the denatured gluten. The soluble gluten samples were extracted almost equally with different solvents including water.
Differences in solubility affect to the analysis results. Currently the prolamin contents obtained by the R5 ELISA are multiplied by two to get the total gluten content of the sample. According to the Codex Standard, prolamins can be extracted to ethanol solutions and they generally account a half of the total gluten proteins. However, this ratio does not apply when other solvents than ethanol are used for the extraction, e.g. the cocktail solution. The absorbances measured to the vital gluten samples were very close to the absorbances obtained by the gliadin standard of the ELISA assay (Figure 4) indicating both gliadins and glutenins are recognised by the antibody.
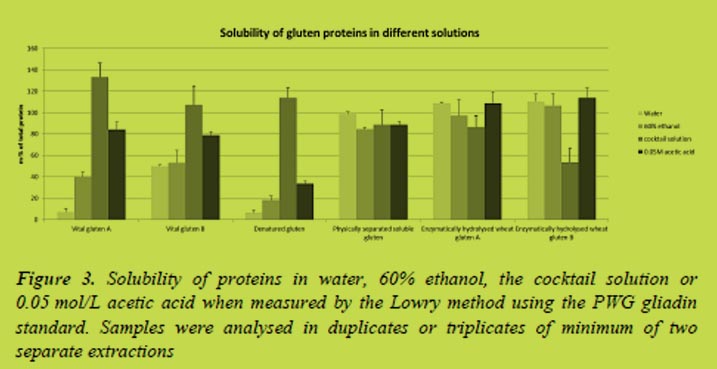
The deamidation degrees for the samples were 32% for Vital gluten B when compared to Vital gluten A, which may explain its higher solubility in water. The deamidation degree of denatured gluten was 30% and between 69 and 71% for the soluble gluten samples. Although, high degree of deamidation might explain the high solubility of soluble gluten samples, it does not increase the solubility of denatured gluten sample.
The gluten samples were analysed by the sandwich R5 ELISA (Figure 4). The curves for vital gluten samples were close to the curve of gliadin standard of the assay. One of the soluble gluten samples was similar to the vital gluten and denatured gluten samples while two of the soluble gluten samples were not measured accurately. These soluble gluten samples were prepared by enzymatic hydrolysis what may explain their different behaviour. The competitive R5 ELISA assay was used to analyse them with better accuracy (Figure 4).
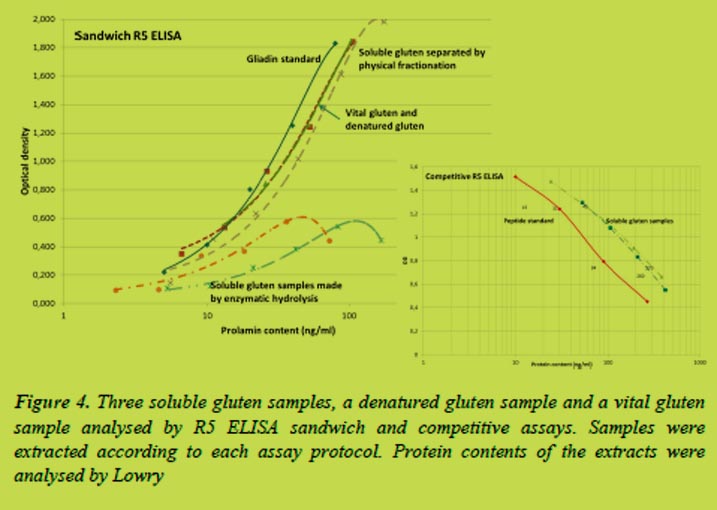
The commercially manufactured soluble gluten ingredients were recognised by the R5 antibody, although with about a half smaller intensity. Obtained results were different from previous results which showed that modification of gluten proteins by acid deamidation decreased or totally eliminated the antibody recognition [6]. Based on these and previous results, there is a significant effect on the ELISA measurements whether proteins are modified by physical treatment or by enzymatic means.
A competitive technique offered better results for the enzymatically hydrolysed gluten, whereas a sandwich method was needed for all of the other gluten samples due to the considerably lower solubility of proteins in ethanol than in cocktail solution. However, when analysing gluten content from products containing small amounts of added modified gluten (e.g. ice cream), it is difficult to select the right method.
Conclusions
Modification of gluten proteins impairs the reliability of the results when analysing the total gluten contents. For vital gluten samples the ELISA methods showed good accuracy, but after modification the reactivity of the proteins was decreased. The protocol used for improving solubility of gluten had somewhat different consequences; the enzymatic deamidation significantly decreased the reactivity between proteins and the antibody, whereas the enzymatic hydrolysis or physical treatment had a smaller effect. However, the choice of the most suitable ELISA technique, sandwich or competitive, is very important for accurate results.
References
1. Kong X, Zhou H, Qian H. Enzymatic preparation and functional properties of wheat gluten hydrolysates. Food Chem 2007; 101: 615-620.
2. Popineau Y, Huchet B, Larré C, et al. Foaming and emulsifying properties of fractions of gluten peptides obtained by limited enzymatic hydrolysis and ultrafiltration. J Cereal Sci 2002; 35: 327-335.
3. Yong YH, Yamaguchi S, Matsumura Y. Effects of enzymatic deamidation by protein-glutaminase on structure and functional properties of wheat gluten. J Agric Food Chem 2006; 54: 6034-6040.
4. Agyare KK, Xiong YL, Addo K. Influence of salt and pH on the solubility and structural characteristics of transglutaminase-treated wheat gluten hydrolysate. Food Chem 2008; 107: 1131-1137.
5. Liao L, Zhao M, Ren J, et al. Effect of acetic acid deamidation-induced modification on functional and nutritional properties and conformation of wheat gluten. J Sci Food Agric 2010; 90: 409-417.
6. Kanerva P, Brinck O, Sontag-Strohm T, et al. Deamidation of gluten proteins decreases the antibody affinity in gluten analysis assays. J Cereal Sci 2011; 53: 335-339.
4.6 Development of a non-immunochemical method for gluten quantitation
Katharina Konitzer, Herbert Wieser, Peter Koehler
German Research Center for Food Chemistry, Freising, Germany
Abstract
The accurate determination of the gluten content in many supposedly gluten-free foods remains a challenge. Although immunochemical methods based on antibodies raised against specific amino acid sequences of prolamins offer sufficient sensitivity to detect very low amounts of gluten, non-immunochemical methods are needed to verify the results especially in complex food samples. Due to the selective detection of prolamins the gluten content is currently calculated by multiplying the prolamin content by factor 2, which was shown to lead to a considerable underestimation of the gluten content in specific starch samples where the prolamin/glutelin ratio is below 1. Therefore, it is necessary to quantify the real gluten content by analysing both the prolamin and the glutelin fraction by liquid chromatographic methods. Compared to UV, detection of protein autofluorescence was shown to be 10 times more sensitive resulting in much lower limits of detection and quantitation. Future work will focus on selecting a suitable fluorescent labelling agent to improve both selectivity and sensitivity of the HPLC method for gluten proteins and on the determination of characteristic proteins or peptide sequences by LC-MS/MS.
Gluten analysis
General considerations
The thresholds of 20 mg/kg for gluten-free and 100 mg/kg for very low gluten foods as stated in the Codex Alimentarius and the EU Commission Regulation No. 41/2009 require highly sensitive analytical methods for gluten quantitation to ensure the safety of products for coeliac disease patients. General requirements for the analysis of the gluten content in foods include the use of a reference material for method calibration with distinct protein composition and content to convert the measured signal into prolamin or gluten concentration, a sufficiently sensitive method suitable for routine analysis and an independent reference method to verify the routine method.
Currently, PWG-gliadin from a mixture of 28 European wheat cultivars, which has been extensively characterised [1], is available as a reference material for method calibration. It is, however, not certified. Immunochemical methods with sufficient sensitivity, the sandwich ELISA for intact and the competitive ELISA for partially hydrolysed gluten, are in use and have been evaluated in collaborative studies [4]. Beyond that reference methods based on real-time PCR [3], and liquid chromatography coupled with UV detection [4-6] or mass-spectrometry [7] are being developed, but they are not yet suitable for routine food analysis. Since there is no accepted method to determine the gluten content directly by measuring the responsible proteins, gluten is determined by quantifying prolamins and multiplying the obtained prolamin content by factor two.
Immunochemical methods (ELISA)
Enzyme linked immunosorbent assays (ELISA) are based on monoclonal antibodies raised against specific amino acid sequences of storage proteins. The storage proteins are extracted from the sample either with aqueous ethanol to obtain the prolamins or with a cocktail solution containing a reducing agent such as β-mercaptoethanol to obtain both the prolamins and the glutelins. While ELISA methods based on the R5 (raised against ω-secalin) or G12 (raised against part of the toxic 33-mer from α-gliadin) antibodies are fast, suitable for routine analysis, require no specialised equipment, and are sensitive enough to detect gluten well below the 20 mg/kg threshold there are also some disadvantages to these immunochemical methods. The results are strongly dependent on the reference protein used for calibration, on the type of antibody used, and on the sensitivity for different cereal species. Since only specific amino acid sequences from certain prolamin types are analysed the gluten content is simply calculated from the prolamin content by multiplying by factor 2, which may lead to either over- or, more gravely for coeliac patients, underestimation of the real gluten content in the sample [6]. For the same reason other T-cell stimulatory epitopes from low molecular weight glutenin subunits are not recognised. Moreover, ELISA methods are incapable of detecting gluten in processed foods where gluten proteins have been deamidated, and the competitive assay is unsuitable for heated proteins because it is only compatible with ethanol extraction.
In order to verify the results obtained by ELISA new, independent reference methods have to be developed. Therefore, the aim was to establish a non-immunochemical method for gluten quantitation using reversed-phase HPLC coupled with UV, fluorescence (FLD) or mass spectrometric (MS) detection.
Non-immunochemical methods
Gluten quantitation by RP-HPLC-UV [5, 6]
Single kernels, flours, dough, and gluten were sequentially extracted first with buffered NaCl solution at 20 °C to obtain the albumins and globulins, secondly with 60% ethanol at 20 °C to obtain the prolamins and finally with 50% 1-propanol/urea/Tris-HCl/DTE at 60 °C to obtain the glutelin subunits. These protein fractions were separated by RP-HPLC on C8 silica gel with an acetonitrile gradient at 50 °C and quantified by UV absorbance at 210 nm.
Very good linear correlations were observed between the UV absorbance signal at 210 nm and the amount [μg] of gliadin, low or high molecular weight glutenin subunits or even bovine serum albumin. The prolamin/glutelin ratios of wheat, spelt, emmer, barley, einkorn, and oat flours, and wheat starch samples were determined. While the prolamin/glutelin ratio is typically approximately 2 in wheat flours, the ratios vary considerably in other cereals, but are all greater than 1. Ratios below 1 only occurred in wheat starch samples, in which prolamins were apparently washed out during processing. The calculation of the gluten content by simply multiplying by factor 2 is therefore not valid in these samples and may lead to a considerable underestimation of the gluten content which may pose a serious risk for coeliac patients.
Quantitation of gluten by RP-HPLC-UV offers a number of advantages. The real gluten content can be determined by summarising the prolamin and the glutelin content instead of simply multiplying the prolamin content by factor 2. An absolute quantitation is possible with any protein reference and it provides basic data on gluten composition. HPLC is equally suitable for routine application and it may be used as a reference method in collaborative studies. However, there are also some drawbacks. Due to the possible interference of other proteins present in food samples, the HPLC method is not selective enough and is, therefore, limited to raw materials such as flours and starches. The limit of quantitation was determined to be approximately 250 mg/kg, which is clearly not sensitive enough and the analysis time with 4 h per sample is rather long. Since it is known that fluorescence and laser-induced fluorescence detection are more sensitive than UV detection [8], the already established RP-HPLC-UV method was used as a basis for a modified RP-HPLC method with fluorescence detection (FLD) to increase sensitivity.
Gluten quantitation by RP-HPLC-FLD
Proteins show autofluorescence due to the aromatic amino acid side chains of phenylalanine, tyrosine, and tryptophane which have specific excitation and emission wavelengths (Table 1).

The autofluorescence of a PWG-gliadin solution (1.25 mg/mL in 60% ethanol) was measured at these three combinations of excitation/emission wavelengths. The highest signal intensity was observed with an excitation at 223 nm and fluorescence emission at 303 nm (Figure 1). These wavelengths were thus used for all subsequent measurements.
In order to evaluate the sensitivity of fluorescence detection compared to UV detection, a diode-array detector (DAD) was connected to the HPLC system in addition to the fluorescence detector. The DAD chromatograms were analysed at a wavelength of 210 nm and the respective signal intensities were plotted against the injected amount of PWG-gliadin (Figure 2).
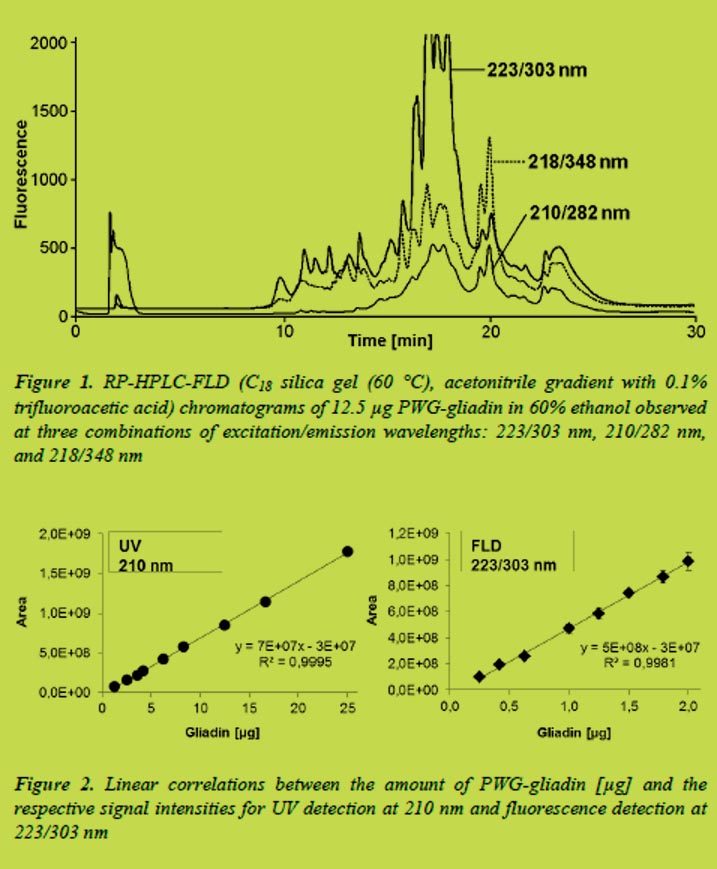
Very good linear correlations even at low gliadin concentrations were obtained for both methods of detection. The limits of detection (LOD) and quantitation (LOQ) were 1.3 and 2.5 μg, respectively, for UV detection at 210 nm. In contrast to that, detection of protein autofluorescence at 223/303 nm was 10 times more sensitive with a LOD of 0.13 μg and a LOQ of 0.25 μg.
While RP-HPLC-FLD essentially has the same drawbacks as discussed above for RP-HPLC-UV, it offers a 10-fold increase in sensitivity when measuring protein autofluorescence. Considering an estimated detection limit of approximately 25 mg gluten/kg, future work will focus on increasing both selectivity and sensitivity for gluten proteins in flour and starch samples.
Conclusion and perspectives
Although ELISA methods offer sufficient sensitivity for gluten analysis below the 20 mg/kg threshold and are suitable for routine analysis, there is a need for independent analytical methods to confirm ELISA results especially in complex food samples. Since the conversion of prolamin concentration to gluten content (currently multiplication by factor 2) depends on the prolamin/glutelin ratio, there is a need for the analytical determination of both prolamins and glutelins either by new antibodies or non-immunochemical methods like RP-HPLC coupled with UV, FLD or MS/MS detection. Further studies will aim at labelling gluten proteins with a suitable dye to increase both selectivity and sensitivity of fluorescence detection. Regarding LC-MS/MS, characteristic proteins or peptide sequences have to be selected and quantified with the use of stable isotope labelled standards. Beyond all this an appropriate protein reference needs to be established for each method to ensure the correct analytical determination of the true gluten content in (gluten-free) foods for the safety of coeliac disease patients.
References
1. Van Eckert R, Berghofer E, Ciclitira PJ, et al. Towards a new gliadin reference material - isolation and characterisation. J Cereal Sci 2006; 43: 331-341.
2. Immer U, Haas-Lauterbach S. Gliadin as a measure of gluten in foods containing wheat, rye, and barley – enzyme immunoassay method based on a specific monoclonal antibody to the potentially celiac toxic amino acid prolamin sequences: collaborative study. J AOAC Int 2012; 95: 1118-1124.
3. Zeltner D, Glomb MA, Maede D. Real-time PCR systems for the detection of the gluten-containing cereals wheat, spelt, kamut, rye, barley and oat. Eur Food Res Technol 2009; 228: 321-330.
4. Haraszi R, Chassaigne H, Maquet A, et al. Analytical methods for detection of gluten in food – method developments in support of food labelling legislation. J AOAC Int 2011; 94: 1006-1025.
5. Wieser H, Antes S, Seilmeier W. Quantitative determination of gluten protein types in wheat flour by reversed-phase high-performance liquid chromatography. Cereal Chem 1998; 75: 644-650.
6. Wieser H, Koehler P. Is the calculation of the gluten content by multiplying the prolamin content by a factor of 2 valid? Eur Food Res Technol 2009; 229: 9-13.
7. Sealey-Voyksner JA, Khosla C, Voyksner RD, Jorgenson JW. Novel aspects of quantitation of immunogenic wheat gluten peptides by liquid chromatography-mass spectrometry/mass spectrometry. J Chromatogr A 2010; 1217: 4167-4183.
8. Chan KC, Veenstra TD, Issaq HJ. Comparison of fluorescence, laser-induced fluorescence, and ultraviolet absorbance detection for measuring HPLC fractionated protein/peptide mixtures. Anal Chem 2011; 83: 2394-2396.
4.7 Coeliac-specific peptidase activity of barley and rye malt as affected by the conditions of germination
Verena Knorr1, Roland Kerpes2, Martin Zarnkow2, Herbert Wieser1, Thomas Becker2, Peter Koehler 1
1 German Research Center for Food Chemistry, Freising, Germany
2 Chair for Brewing and Beverage Technology, Technical University of Munich, Freising, Germany
Introduction
Approximately 1% of the Western population suffer from coeliac disease (CD), which involves destruction of the villous structure of the intestine and leads to malabsorption and deficiency syndroms. CD is triggered by storage proteins of wheat (gliadins and glutenins), rye (secalins) and barley (hordeins) [1]. Within the limits of the lifelong gluten-free diet patients are not allowed to drink conventional beer but have to switch to surrogates made from gluten-free cereals or pseudo cereals. These products are not compliant to the German purity law and differ from the expectations of consumers. It is known that during germination there is a massive degradation of gluten by endogenous peptidases. Preliminary results showed that extracts from germinated cereals were able to degrade gluten in a malt drink below the threshold of 20 mg/kg for gluten-free foods [2]. Therefore, it is likely that endogenous cereal peptidases activated during germination would be capable of extensively hydrolysing gluten in malt products. The aim of this study is to develop a special malt with a high peptidase activity by optimising the conditions of germination and the production of a gluten-free beer compliant to the German purity law, in which quality parameters such as taste and foam stability are comparable to conventional beers.
Materials and methods
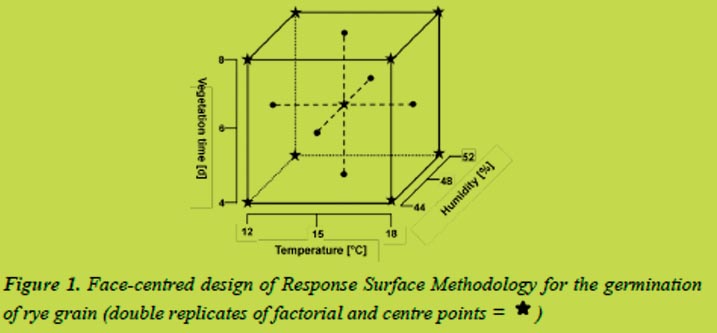
The rye variety Dukato and the barley variety Marthe were malted under controlled conditions in which the parameters germination time (four to eight days), humidity (44 - 52% for rye, 42 - 48% for barley) and temperature (12 to 18 °C) were varied systematically. The Response Surface Methodology (RSM) in a face-centred design was used to select suitable combinations of the parameters (Figure 1).
The germinated grains were kiln-dried (16 h/50 °C, 1 h/60 °C, 1 h/70 °C, 5 h/80 °C), milled and endogenous enzymes were extracted with brewing water. Afterwards the coeliac-active peptides PQPQLPYPQPQLPY (P1, from α-gliadin) and SQQQFPQPQQPFPQQP (P2, from γ-hordein) were incubated with the malt extracts at 50 °C for 60 (P1) and 90 min (P2), respectively, using saccharin as an internal standard [3,4]. Coeliac-specific peptidase activity was calculated after RP-HPLC-UV by comparing the peak areas of the incubated and non-incubated substrates. Fragments of P1 and P2 formed during the partial hydrolysis were analysed by LC-MS2.
Results and discussion
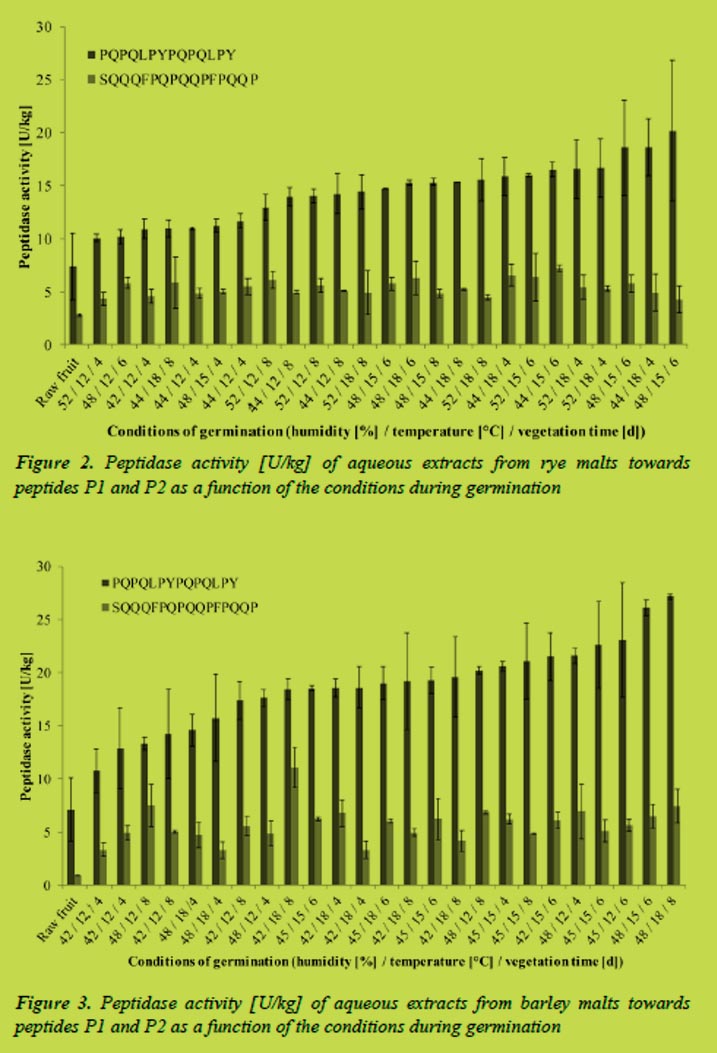
Enzymes from germinated rye and barley extracted with water were able to degrade the coeliac-active peptides P1 and P2. The activities were calculated from the hydrolysis rates determined by RP-HPLC. For rye, coeliac-specific activities were between 10 and 20 U/kg malt flour for P1, which equaled up to 40% degradation per hour. Activities towards P2, between 4 - 7 U/kg, which equaled a degradation-rate up to 20% per hour, were clearly lower than towards P1. Comparing gluten-specific peptidase activities of malt and ungerminated rye revealed significant differences for both substrates (Figure 2).
Parameters for maximum peptidase activity were determined by means of the RSM software. The resulting models were significant for peptide P1 but not for P2. To induce a maximum activity towards P1 rye should be germinated for six days at 16 °C. Changes in the humidity had no significant effects on the peptidase activity. Regarding other factors important for the brewing process, such as extract, viscosity or practicability, germination for four days at 18 °C and a humidity of 44% was found to be most suitable.
In terms of barley calculated peptidase activities were slightly higher compared to rye. Activities towards peptide P1 were between 5 - 25 U/kg and about 5 U/kg towards P2. This equaled degradation-rates up to 45%/h for the gliadin peptide and up to 20%/h for the hordein peptide. Compared to the ungerminated grains the special malt had a significantly higher coeliac-specific activity (Figure 3).
To induce maximum peptidase activity towards the hordein peptide germination for eight days at 12 °C and a humidity of 48% was necessary. Considering other parameters relevant for brewing, germination for seven days at 14 °C and humidity of 48% yielded the best result.
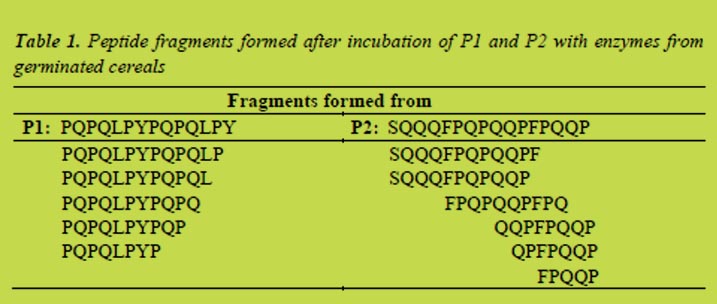
Fragments of P1 and P2 generated during the partial hydrolysis with enzymes extracted from germinated cereals were analysed by LC-MS2. The most relevant products of the hydrolyses are listed in Table 1. In the case of P1 the fragments showed that mainly carboxyexopeptidases had been active. Fragments formed during incubation of P2 pointed to the presence of both amino- and carboxypeptidases. Furthermore the results confirmed that endogenous peptidases were able to hydrolyse peptide bonds containing proline, which resist cleavage by human gastro-intestinal peptidases. Moreover, some of the fragments formed after incubation contained less than nine amino acids.
Conclusions
The experiments showed that special malts from rye and barley had peptidase activities capable of degrading coeliac-active peptides. Compared to ungerminated cereals the activity was significantly higher. Considering peptidase activity as well as parameters important for the brewing process, germination of rye for four days at 18 °C and a humidity of 44% and germination of barley for seven days at 14 °C and a humidity of 48% yielded the best results. Endogenous cereal enzymes were able to cleave peptide bonds of proline yielding peptide fragments with a length of less than nine amino acids, which were no longer toxic to coeliac patients.
Acknowledgements
This research project was supported by the German Ministry of Economics and Technology (via AiF) and the FEI (Forschungskreis der Ernährungsindustrie e.V., Bonn). Project AiF 16971N
References
1. Wieser H, Koehler P. The biochemical basis of celiac disease. Cereal Chem 2008; 85: 1-13.
2. Koehler P, Geßendorfer B, Wieser H. Preparation of partially hydrolysed prolamins as references for the immunochemical quantitfication of gluten in cereal-based beverages. In: Stern (ed): Proceedings of the 23th Meeting, Working Group on Prolamin Analysis and Toxicity. Verlag Wissenschaftliche Scripten, Leipzig, 2009; pp. 35-40.
3. Vader, L. W, Stepniak D. T, Bunnik E. M, et al. Characterization of cereal toxicity for celiac disease patients based on protein homology in grains. Gastroenterol 2003; 125: 1105-1113.
4. Geßendorfer B, Hartmann G, Wieser H, Koehler P. Determination of celiac disease-specific peptidase activity of germinated cereals. Eur Food Res Technol 2011; 232: 205-209.
4.8 Oat avenins do not contain coeliac disease epitopes known from wheat, rye and barley
Diana M. Londono1, Wendy P.C. van ‘t Westende1, Svetlana V. Goryunova2, Elma M.J. Salentijn1, Hetty C. van den Broeck1, Ingrid M. van der Meer1,3, Richard G.F. Visser1, Luud J.W.J. Gilissen1,3, Marinus J.M. Smulders1,3
1 Wageningen UR, Wageningen, The Netherlands
2 Vavilov Institute of General Genetics, Moscow, Russia
3 Allergy Consortium Wageningen, Wageningen, The Netherlands
Introduction
There is an increasing demand for gluten-free products and oats are considered an interesting alternative because it contains healthy compounds that can supplement the diet [1], and it has generally been accepted that CD patients can consume oats without detrimental inflammation of the small intestine [2]. Recently the safety of oats has been disputed because two avenin peptides were described as epitopes (Av-α9B, Av-α9A) for their capacity to trigger proliferation of T cells in few patients [3]. Additionally, differential signals of gluten-specific monoclonal antibodies and in vitro T cells to oat varieties suggested the existence of immunogenicity related to gluten in oat [4, 5]. The objective of this study was to clarify the nature of those responses, i.e. whether they might be due to the identified avenin-specific epitopes or to the presence of epitopes known from wheat, barley and rye. For this we studied the diversity of avenins of genomes (A, D, C) that exist within the genus Avena.
Materials and methods
We cloned and sequenced avenin genes from genomic DNA of thirteen diploid, tetraploid and hexaploid Avena species representing the major genomes that occur within the genus Avena. Additionally we cloned and sequenced avenin genes from cDNA of the hexaploid Avena sativa cv. ‘Gigant’ to estimate the number of avenins transcribed in a single cultivar, we also analysed an EST library in GenBank from another hexaploid cultivar, ‘Dancer’. Genomic DNA was extracted using the DNeasy Plant Mini kit and messenger RNA was extracted using TRIzol and the RNeasy Plant Mini kit (Qiagen). The iScript cDNA Synthesis Kit (Bio-Rad) was used to synthesise cDNA. Seven different primer combinations were designed on conserved regions at the 5’ and 3’ ends of the coding sequence of avenin ESTs from ‘Dancer’. Sequences obtained from cDNA and gDNA, and the EST library were assembled into contigs of >99% identical sequences. All sequences were translated into amino acid sequences to perform a Bootstrap Neighbor-Joining test. Translated avenin protein sequences were screened for the presence of CD T cell epitopes [3] as well as for all possible variants of these epitopes with 1, 2 or 3 amino acid substitutions using PatternSearch [6].
Results and discussion
Avenin proteins obtained from diploid, tetraploid and hexaploid Avena species clustered in four groups, two of which contained the avenin T cell epitopes Av-α9B (PYPEQQQPF) and Av-α9A (PYPEQQEPF). Hexaploid oat cultivars expressed about 10 avenin proteins coming from different groups. Gluten T cell epitopes from wheat, rye and barley were not found in oat avenins; some variants with two and tree amino acid substitutions were present, but they are predicted to be proteolysed in the gastro-intestinal tract. These results show that the reported proliferation of T cells in few CD patients after oat challenge is triggered by the two described avenin epitopes, and that these epitopes are likely to be present in all oat cultivars. The frequency of T cells in CD patients that respond to these avenin epitopes is unknown, but the fact that 70% of CD patients in Finland consume oats without presenting complaints [7] suggest that their frequency is low.
The recognition sites of the antibodies R5 and G12 were also absent in oat avenins but variants with one and two amino acid substitutions were present (Table 1 and Table 2). Therefore, positive signals of monoclonal antibodies to oat extracts may be generated due to cross-reactivity with avenin peptides, but such signals should not be interpreted as differences in immunogenicity for CD patients.
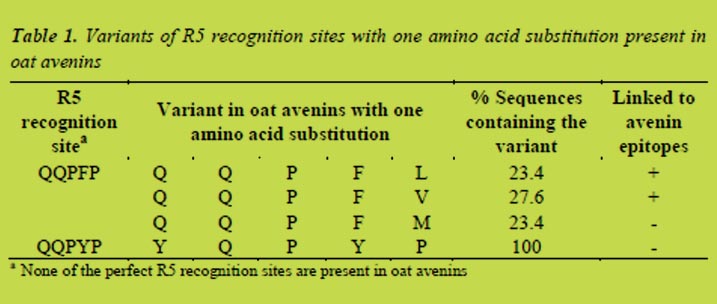
This work presents, for the first time, a thorough evaluation of the sequence diversity of avenin genes across the entire genus Avena (oat). We have studied the presence of CD DQ2/8 T cell epitope sequences of wheat, barley and rye - according to current international agreement [3] -, the occurrence of the two avenin-specific CD epitopes, and the existence of possible recognition sequences of several monoclonal antibodies (mAbs) that are applied in commercially available gluten detection kits. Those results enable to discuss the safety of oats for patients suffering from CD.
Conclusions
Known gluten T cell epitopes from wheat, rye and barley are not present in oats and therefore T cell responses of CD patients to oat extracts are most likely induced by the two described avenin-epitopes, which are likely to be present in all oat cultivars. The low number of avenin genes with these epitopes allows removing the avenin epitopes by advanced breeding strategies, in order to generate completely safe oat cultivars. Positive signals of monoclonal antibodies to oat extracts are possibly due to cross-reactivity with avenins, but such aspecific signals should not be interpreted as differences in immunogenicity for CD patients.
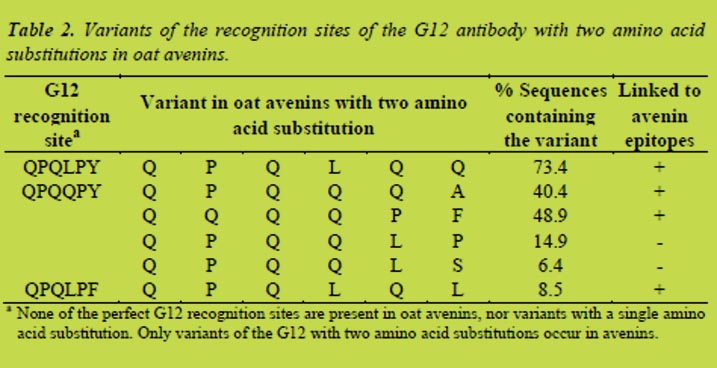
References
1. Andon M, Anderson J. The oatmeal-cholesterol connection: 10 years later. Am J Lifestyle Med 2008; 2: 51-57.
2. Janatuinen EK, Kemppainen TA, Julkunen RJK, et al. No harm from five year ingestion of oats in coeliac disease. Gut 2002; 50: 332-335.
3. Sollid LM, Qiao SW, Anderson RP, Gianfrani C, Koning F. Nomenclature and listing of celiac disease relevant gluten T-cell epitopes restricted by HLA-DQ molecules. Immunogenetics 2012; 64: 455-460.
4. Lundin KEA, Nilsen EM, Scott HG, et al. Oats induced villous atrophy in coeliac disease. Gut 2003; 52: 1649-1652.
5. Comino I, Real A, de Lorenzo L, et al. Diversity in oat potential immunogenicity: basis for the selection of oat varieties with no toxicity in coeliac disease. Gut 2011; 60: 915-922.
6. Salentijn EMJ, Mitea DC, Goryunova SV, et al. Celiac disease T cell epitopes from gamma-gliadins: immunoreactivity depends on the genome of origin, transcript frequency, and flanking protein variation. BMC Genomics 2012; 13: 277.
7. Salovaara HO, Kanerva P, Loponen J, Sontag-Strohm TS. Oats in gluten-free diet, considerations of a pragmatic policy. Second International Symposium on Gluten-Free Cereal Products and Beverages, (University of Helsinki), 2010; pp 193-194.
5. Clinical research reports
5.1 CXCR3 / CXCL10 axis in intestinal mucosa in active coeliac disease
Constanza Bondar1, Luciana Guzman2, Eduardo Cueto Rua2, Nestor Chopita3, Fernando Chirdo1
1 Laboratorio de Investigación en el Sistema Inmune – LISIN. Facultad de Ciencias Exactas. Universidad Nacional de La Plata. La Plata
2 Servicio de Gastroenterología, Hospital de Niños “Sor María Ludovica” La Plata
3 Servicio de Gastroenterología. Hospital San Martín, La Plata. Argentina
Introduction
Coeliac disease (CD) is a chronic small intestinal inflammatory condition induced by an inappropriate immune response to dietary gluten. Priming of gluten-specific naive T cells occurs in organised lymphoid tissue, likely in the mesenteric lymph nodes, whereas the activation and expansion of these cells take place in the small intestine lamina propria by antigen presenting cells. Majority of gluten specific T cells are Th1 cells, and consequently γIFN producers [1]. Lamina propria also contains a high number of plasma cells, most of them producing anti-TG2 antibodies [2].
Therefore, lymphocytic infiltration mainly composed by CD4+ Th1 cells and plasma cells is one of the chararacteristic findings in intestinal mucosa in active CD. The increased number of lymphoid cells is a consequence of local expansion and/or a specific cell recruitment.
Cell migration into the small intestine mucosa requieres different signals from two main systems that guide this process. Expression of adhesion molecules in the endothelial cells, the best example is MadCAM1, and the expression of α4β7 in lymphoid cells allow the migration of cells out of the blood vessels into the tissue [3]. Inside the tissue, chemokines guide the cells to the site of inflammation. The CXCL10/CXCR3 axis is one of the main factors controlling the cell recruitment under an inflammatory process, as it was reported for chronic inflammatory process such as autoimmunity (type 1 diabetes, reumatoid arthritis)[4, 5].
IFNγ is the stronger inducer of CXCL10 expression. CXCL10 is produced by CD4+ T cells, NK and NKT cells, monocytes, dendritic cells, neutrophils, fibroblasts [6]. Remarkably, synoviocytes and β cells, actively produce CXCL10 during the inflammatory process, arthritis or insulitis, respectively [5]. CXCL10 interacts with CXCR3, which is expressed by T lymphocytes, NK cells, eosinophils, monocytes, B lymphocytes, plasma cells. Particularly, Th1 cells are CXCR3+ cells [6].
CXCR3 interacts not only with CXCL10 but also with CXCL9 and CXCL11. These chemokines are differentially expressed in different pathological conditions suggesting that they have non-redundant biological functions [7].
In a previous study, we showed that mRNA level of CXCL10 was significantly higher in intestinal biopsies of paediatric or adult CD patients compared to healthy controls [8]. We did not observe statistical difference for CXCR3 expression when control and CD samples were compared. However, the analysis by immunofluorescence of sections of small intestine revealed that the number of CXCR3+ cells was substantially higher in untreated CD samples compared to controls.
The analysis of CXCL10 expression by immunofluorescence confocal microscopy showed that the intestinal lamina propria of untreated CD patients contained such a high amount of CXCL10 that positives cells could not be properly counted.
The aim of this work was to investigate the role of CXCR3 and its ligands in CD pathogenesis.
Patients and methods
Peripheral blood sample and duodenal biopsies were taken from pediatric and adult patients suffering from different gastrointestinal symptoms on the routine procedure to diagnose CD. For some experiments, duodenal biopsies samples from coeliac patients under gluten free diet were also analysed. Diagnosis was acchieved by clinical evaluation, histological examination and serology. The present study was approved by the Ethical Committees of the HIGA San Martin and Sor Maria Ludovica Hospitals from La Plata.
Quantitative Real-Time PCR was performed to determine the RNAm level of CXCL9, CXCL10 and CXCL11 using specific pairs of primers. Quantitative PCR was performed in iCycler Real Time PCR (BioRad). β-actin as housekeeping gene was used for normalisation.
Counting of CXCR3+ cells in the intestinal mucosa was performed in sections of duodenal biospies from untreated CD patients, patients on gluten-free diet and controls. Anti-CXCR3 antibody (R&D Systems; Cat: MAB160) and Alexa 488 F(ab´)2 fragment of goat anti mouse IgG (H+L) (Invitrogen, cat A11020) were used for staining.
Images were taken in a SP5 Leica confocal microscopy, and then analysed by Image J software Counting was performed by using Image J software properly calibrated to measure the areas. Lamina propria areas were drawn over the entire histological section and positive cells were counted over a total of 150000 μm2 on averege. Surface epithelium, villi and crypts were excluded. All countings were performed blindly by the same investigator.
Concentration of CXCL10 in serum samples was determined using the ELISA kit Human IP-10 (CXCL10) from Invitrogen (cat KAC2361) following manufacturer’s instructions.
Results and discussion
Previous results from our group showed the participation of the CXCR3/CXCL10 axis in CD pathogenesis [8]. The expression of CXCR3 was studied by quantitative RT-PCR in duodenal biopsies from CD patients and controls. Though we did not observe a differential expression of CXCR3 at mRNA level, we showed that the number of CXCR3+ cells was increased in active CD. We extended this analysis by including duodenal samples of CD patients on gluten-free diet (Figure 1). The number of CXCR3+ cells in active CD was clearly higher compared to control samples and samples from treated CD patients. Though we could not identify the cells expressing CXCR3, it is likely that part of CXCR3+ cells belong to the Th1 subset.
We also observed that CXCL10 is strongly upregulated at mRNA level in the small intestine lamina propria in active CD [8]. We further studied the expression of CXCL9, CXCL10 and CXCL11. All these chemokines, ligands for CXCR3, have non-redundant biological roles and are differentially expressed in tissues under pathological conditions. We studied by quantitative PCR the levels of these three chemokines in the same set of duodenal samples from CD patients and controls. Figure 2 showed that CXCL10 and CXCL11 are upregulated in active CD, but not CXCL9. The level of expression of CXCL10 and CXCL11 showed a high correlation suggesting that common signalling or regulation pathways operate for both chemokines in the intestinal mucosa (not shown).
By confocal microscopy, we also observed a massive production of CXCL10 in the duodenal mucosa in untreated CD patients (not shown). CXCL10 is secreted and bound to the extracellular matrix in order to mediate cell recruitment of CXCR3+ cells.
It was also reported that high levels of CXCL10 can be found in serum of patients with active autoimmune diseases, such as: type I diabetes, thyroiditis and rheumatoid arthritis [9-11].
Using a commercial ELISA test, we evaluated the concentration of CXCL10 in serum samples from CD patients and controls. CXCL10 levels were higher in active CD than in control population (Figure 3). The high concentration of CXCL10 in peripheral blood in active CD is a consequence of the overproduction of this chemokine in the intestinal mucosa. Though, there is no a functional role for this chemokine on peripheral blood, it can be used as a biomarker of the active disease. Further investigation evaluating a large number of samples from both active CD patients and controls populations as well as patients on gluten free diet is necessary to determine the efficiency of this determination as marker of disease status.
We also evaluated the source of CXCL10 in the lamina propria. First we investigated the two main cell populations infiltrating the tissue in the active process: T lymphocytes (CD3+ positive cells) and plasma cells (CD138+). We found that CD138+ cells massively produce CXCL10 (not shown). Since the availability of antibodies to perform studies using confocal microscopy in the intestinal sections limits the study, we cannot rule out other cell populations as CXCL10 producers.
Conclusion
CXCL10 is overproduced in the duodenal mucosa in active CD. Moreover, we demonstrated that the number of CXCR3+ cells is increased in the mucosa of active CD compared with control or treated CD patients. The massive CXCL10 production in the small intestine may be one of the main chemotactic pathways mediating the recruitment of T cells, particularly Th1 CD4+ T cells and plasma cells. Our results suggest that CXCL10 may be also a biomarker for disease activity since CXCL10 levels in serum are significantly higher in untreated patients than in control population.
Altogether these findings highlight the relevance of the CXCR3/CXCL10 axis in CD pathogenesis.
References
1. Meresse B, Malamut G, Cerf-Bensussan N. Celiac disease: an immunological jigsaw. Immunity 2012; 36(6): 907-919.
2. Di Niro R, Mesin L, Zheng NY, et al. High abundance of plasma cells secreting transglutaminase 2-specific IgA autoantibodies with limited somatic hypermutation in celiac disease intestinal lesions. Nat Med 2012; 18(3): 441-445.
3. Gorfu G, Rivera-Nieves J, Ley K. Role of beta7 integrins in intestinal lymphocyte homing and retention. Curr Mol Med 2009; 9(7): 836-850.
4. Lee EY, Lee Z-H, Song YW. CXCL10 and autoimmunity disease. Autoimmunity Rev 2009; 8: 379-383.
5. Lacotte S, Brun S, Muller S, Dumortier H. CXCR3, inflammation and autoimmune disease. Ann NY Acad Sci 2009; 1173: 310-317.
6. Groom J, Luster A. CXCR3 in T cell function. Exp Cell Res 2011; 317: 620-631.
7. Muller M, Carter S, Hofer M J, Campbell IL. The chemokine receptor CXCR3 and its ligands CXCL9, CXCL10 and CXCL11 in neuroimmunity. Neuropathol Appl Neurobiol 2010; 36: 368-387.
8. Bondar C, Araya R, Rulli E, et al. The CXCR3 / CXCL10 axis. Role in coeliac disease pathogenesis. In: Koehler P (ed): Proceedings of the 25th Meeting, Working Group on Prolamin Analysis and Toxicity. Verlag Deutsche Forschungsanstalt für Lebensmittelchemie, Freising, 2012; pp. 61-66.
9. Shigihara T, Oikawa Y, Kanazawa, Y, et al. Significance of serum CXCL10/IP-10 level in type 1 diabetes. J Autoimmun 2006; 26(1): 66-71.
10. Antonelli A, Ferrari SM, Frascerra S, et al. Circulating chemokine (CXC motif) ligand (CXCL)9 is increased in aggressive chronic autoimmunethyroiditis, in association with CXCL10. Cytokine 2011; 55(2): 288-93.
11. Jude C, Dejica D, Samasca G, et al. Soluble CD163 serum levels are elevated and correlated with IL-12 and CXCL10 in patients with long-standing rheumatoid arthritis. Rheumatol Int 2012; Aug 22. [Epub ahead of print].
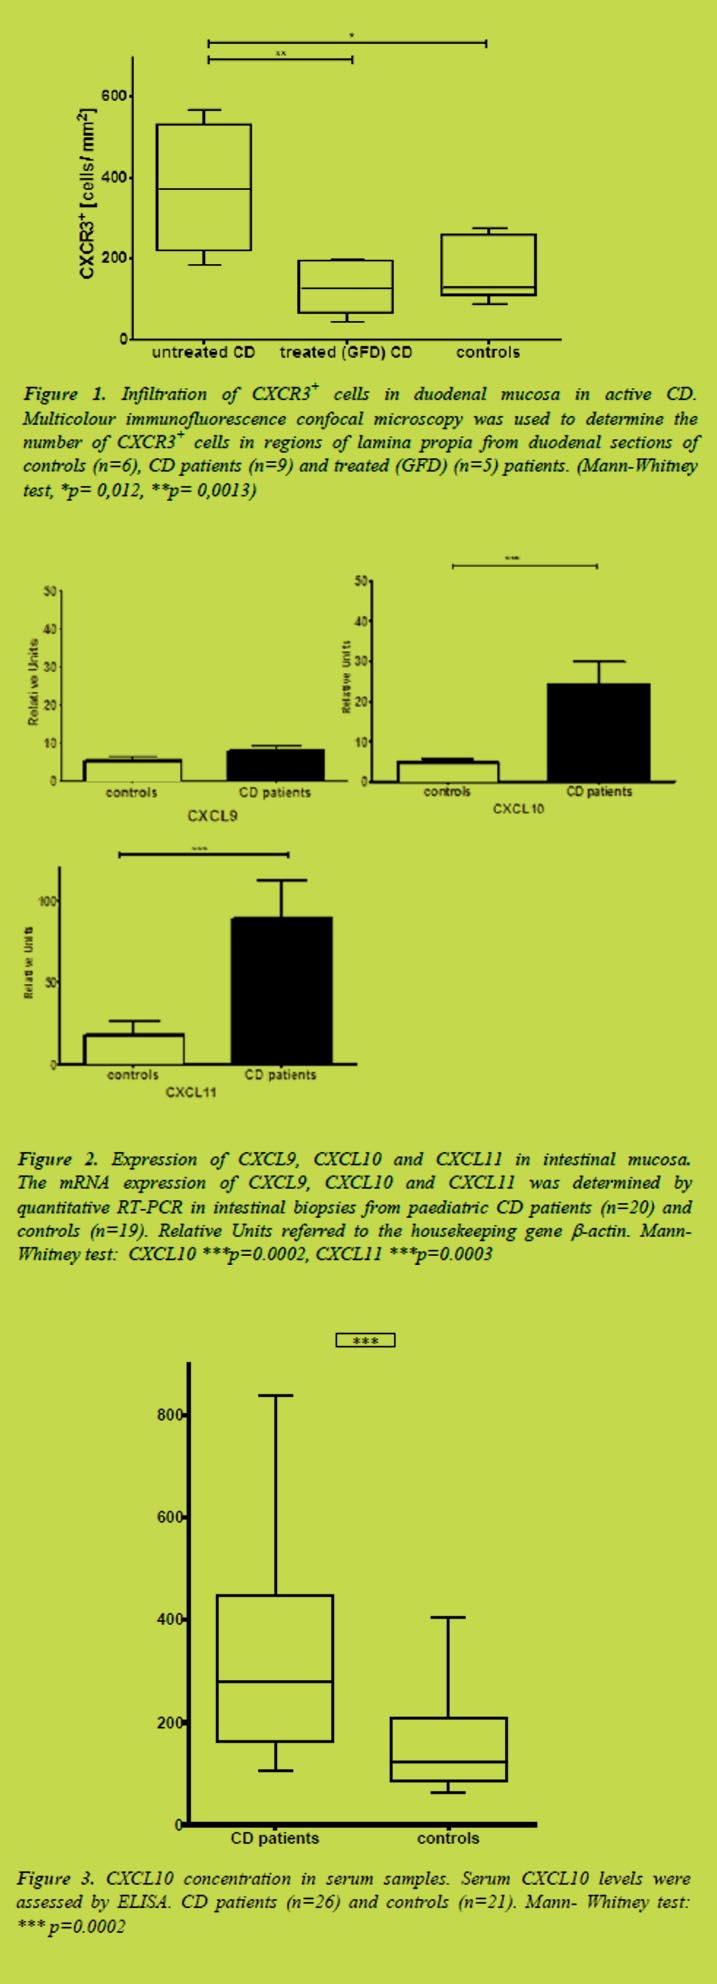
5.2 Coeliac disease immunogenicity studies of barley hordein and rye secalin derived peptides
Widya A. Wahab1, Tanja Šuligoj1, H. Julia Ellis1, Ikram Nasr1 Paul J. Ciclitira1
1 Division of Nutritional Sciences, King’s College London, Rayne Institute, St Thomas’ Hospital, London, UK
Introduction
Coeliac disease (CD), a chronic, immune-mediated small intestinal disorder affects approximately 1% of individuals in the Europe and the U.S. The condition is exacerbated by the consumption of food containing wheat gluten; this includes wheat gliadin and glutenins, rye secalins and barley hordeins. The keystone of CD treatment is strict compliance to a gluten-free diet with exclusion of these cereals.
Several CD toxic peptides were previously identified that are present in wheat. They were used to develop monoclonal antibodies, to quantify wheat gluten in foods for individuals with CD. Recent studies have identified cereal peptides thought to be immunodominant in relation to CD toxicity. An ω-gliadin / C-hordein peptide (QPFPQPEQPFPW) and a rye secalins-derived peptide (QPFPQPQQPIPQ) were previously assessed with gluten sensitive T-cell clones isolated from peripheral blood mononuclear cells, that revealed positive responses suggesting CD toxicity [1].
We wished to assess the immunogenicity of the candidate peptides with more gluten sensitive small intestinal T-cell lines obtained from CD biopsies. We also sought to investigate the possible cross-reactivity of gluten specific T-cell lines with peptic tryptic digested barley hordeins and rye secalins, in addition to the peptides described above.
Material and methods
Prolamins from triticeae (wheat, barley and rye) were prepared by using a standard extraction protocol [2]. Peptic tryptic (PT) digestion of these prolamins was performed by stepwise enzymatic hydrolysis with pepsin from porcine gastric mucosa (Sigma P0609) and trypsin (Sigma T1763), both attached to agarose [3]. Three hundred seventy μg/mL of the digested prolamins fractions that includes (i) PT gluten (PTG), (ii) PT hordeins (PTH) and (iii) PT secalins (PTS) were deamidated for 4 h with 100 μg/mL guinea pig liver tissue transglutaminase (tTG) (Sigma T5398) and 2 mmol/L CaCl2. Small intestinal biopsies from participating coeliac patients (n=26) were cultured for 18 h with 5 mg/mL of PTG (n=14) or PTH (n=10) or PTS (n=2) to establish gluten sensitive T-cell lines as previously described [4,5]. The biopsies were then mechanically disrupted to release the lymphocytes that were filtered through a 70 μm cell filter (Falcon; Becton Dickson Ltd). The cells were cultured with 1 x 10⁶/mL γ-irradiated (22 Gray) autologous peripheral blood mononuclear cells (PBMCs) in RPMI (Invitrogen) medium containing 10% heat inactivated autologous plasma, 25 μg/mL Plasmocin (Invitrogen), 2.5μg/mL amphotericin B (PAA) and 0.01 mol/L of HEPES (N-2-hydroxyethylpiperazine-N’2-ethane sulphonic acid) (Sigma H0887).
The cells were restimulated every seven days with irradiated autologous PBMCs cultured overmight with tTG deamidated PTG/PTH/PTS. PBMCs acted as antigen presenting cells (APCs). T-cell proliferation assays were undertaken after one or more antigenic restimulation. The antigens tested were tTG deamidated PTG or PTH or PTS (100 μg/mL), the ω-gliadin / C-hordein peptide (10 μg/mL), and rye secalins-derived peptide (10 μg/mL). The T-cells and APC with PHA served as positive controls at a final concentration of 10μg/mL. PBMCs (5 x 10⁴/well) were irradiated (22 Gray) to prevent the APCs proliferating. The APCs were then incubated at 37°C for 18 h for the more complex antigens (deamidated PTG/PTH/PTS) and 4 h for the smaller peptides, prior to addition of T-cells (5x 10⁴/well). Each test was established in triplicate. Following 48 h incubation, 20 μl of a 1 μCi [3H] thymidine was added to each well and the plate incubated for a further 18 h to allow thymidine incorporation prior to harvesting. Proliferative responses to antigens were assessed via incorporation of [3H]-thymidine, and regarded as positive if the stimulation indices (SI) > 2.0. The SI was calculated by dividing the mean counts per minute (cpm) in the presence of antigen by the mean cpm in the absence of antigen.
Results and discussion
The results are shown in Table1, Table 2 and Table 3. Wheat gluten specific T-cell lines (n=14), barley hordeins specific T-cell lines (n=10), and rye secalins T-cell lines (n=2) were generated. We found that the selected peptides cross-reactivated with most of the small intestinal T-cell lines that were either specific to wheat gluten (n=9), or barley hordeins (n=6) or rye secalins (n=2), confirming their immunogenicity.
A study conducted by Kilmartin et al. [6] demonstrated the PT digests of CD toxic prolamins (barley and rye) could induce T-cell proliferation in small intestinal T-cell lines of coeliac patients. In this study, all the cell lines were generated using gliadin as the stimulating antigen. Interestingly, our T-cell lines were generated by directly challenging with either PTG or PTH or PTS. This demonstrated the actual ability of these prolamins to activate T-cell responses. Our study has also demonstrated cross-reactivity between (i) wheat gluten sensitive T-cell lines with PTH (n=10) and PTS (n=9); this is shown in Table 1, (ii) barley hordeins sensitive T-cell lines with PTG (n=9); this is shown in Table 2 and (iii) rye secalins sensitive T-cell lines with PTG (n=2); this is shown in Table 3. This suggests that barley hordeins and rye secalins share some CD toxic epitopes that are no less important than wheat gluten in exacerbating CD.
PT prolamins and peptides comprise an abundance of proline (P) (10-15%) and glutamine (Q) (30-35%) residues that were exposed to tTG to induce the potential selective deamidation of the peptides that is required for HLA-DQ2/8 binding, for efficient presentation to the gluten sensitive T-cells [7].

Conclusion
The cross-reactivity of the studied barley and rye peptides in majority of the gluten sensitive small intestinal T-cell lines indicates that these peptides are not only immunogenic, but also toxic to coeliac patients. In conclusion, the findings suggest that barley hordeins and rye secalins share certain toxic epitopes present in wheat gluten proteins that is clearly demonstrated by the cross-reactivity with the specific T-cell lines described above.
Acknowledgements
Widya Abd Wahab wishes to acknowledge funding from the Malaysia Government (MOHE), and International Islamic University Malaysia(IIUM), Tanja Šuligoj, the Clinical Research Trust, H. Julia Ellis and Professor P.J. Ciclitira for their assistance.
References
1. Tye-Din JA, Stewart JA, Dromey JA, et al. Comprehensive, quantitative mapping of T-cell epitopes in gluten in coeliac disease. ScienceTranslational Medicine 2010; 2: 1-14.
2. Wieser H, Seilmeier W, Belitz HD. Quantitative determination of gliadin subgroups from different wheat cultivars. J Cereal Sci 1994; 19: 149-155.
3. Bolte G, Osman A, Mothes T, et al. Peptic-tryptic digests of gliadin: contaminating trypsin but not pepsin interferes with gastrointestinal protein binding characteristics. Clin Chim Acta1996; 247: 59-70.
4. Molberg O, McAdam S, Lundin KE, et al. Studies of gliadin-specific T-cells in celiac disease. In Marsh M. N.: Methods in Molecular Medicine, vol. 41. Celiac disease: Methods and Protocols. Totowa NJ: Humana Press.
5. Ellis HJ, Pollock EL, Engel W, et al. Investigation of the putative immunodominant T-cell epitopes in coeliac disease. Gut 2003; 52: 212-217.
6. Kilmartin C, Wieser H, Abuzakouk M, et al. Intestinal T-cell Responses to Cereal Proteins in Celiac Disease. Digestive Diseases and Sciences 2006; 51(1): 202-209.
7. Gebe JA, Swanson E, Kwok WW. HLA Class II peptide-binding and autoimmunity. Tissue Antigen 2002; 59: 78-87.
5.3 Altered distributions of innate lymphocytes in coeliac disease
Margaret Dunne1, Louise Elliott2, Seamus Hussey1, Jacinta Kelly1, Conleth Feighery2
1 National Children’s Research Centre, Our Lady’s Children’s Hospital, Dublin, Ireland
2 Department of Immunology, St. James’s Hospital, Dublin, Ireland
Introduction
Coeliac disease (CD) is defined as a chronic small intestinal immune-mediated enteropathy precipitated by exposure to dietary gluten in genetically predisposed individuals [1]. The only current therapy is a lifelong gluten free diet (GFD). While much work has focussed on the gliadin-specific adaptive immune response in CD, little is understood about the role of innate immunity – particularly the so-called innate, or unconventional lymphocytes. In this study we phenotypically characterise a number of innate lymphocyte subsets - γδ T cells, natural killer (NK) cells, natural T (NT) cells, NK T (NKT) cells, invariant NK T (iNKT) cells and mucosal associated invariant T (MAIT) cells in the blood and gut of adult and paediatric coeliac patients. By comparing the findings to non-coeliac control donors, we aimed to define an innate lymphocyte profile for CD, as a first step towards elucidating the role of these cells in disease pathogenesis.
Materials and methods
Blood and small intestinal tissue biopsies were obtained from patients attending a coeliac clinic or undergoing routine endoscopy at St. James’s Hospital (adult patients) or Our Lady’s Children’s Hospital, Crumlin (paediatric patients). Samples were processed immediately. Intestinal biopsies were treated with sequential incubation with EDTA and DTT (both at 1 mmol/L), then collagenase (130 U/mL) to release epithelial and lamina propria cells, respectively, as per protocol outlined in [2]. Cell suspensions and whole blood samples were stained with antibodies specific for markers typical of innate lymphocytes: CD3-Pacific Blue, γδTCR-PE, Vδ2-PE, CD56-PE/Cy7, Vα7.2-APC, CD161-FITC, CD45RA-FITC, CD49d-PE, HLA-DR-Pacific Blue, TCR Vα24-Jα18-PE, CD27-APC, CCR6-PE, HLA-DQ-FITC, Vδ3-APC, Vδ1-FITC. TruCount analysis of absolute cell numbers was carried out by staining whole blood with BD MultiTEST mAb cocktail specific for CD3/CD16+CD56/CD45/CD19 and run on a BD FACSCanto flow cytometer in the Central Pathology Laboratory at St. James’s Hospital. Serum samples were analysed for tissue transglutaminase and endomysial specific antibodies.
Results and discussion
Significant differences were observed for all circulating innate lymphocyte populations studied in the blood of adult coeliac patients (Figure 1), compared to control donors. All innate populations showed decreases both in frequency and absolute number, when compared to normal control blood. This trend was not seen in the paediatric cohort however (data not shown). Interestingly, innate lymphocyte profiles were significantly altered in coeliac patients regardless of adherence to a gluten free diet. This observation agrees with other studies showing persistence of cellular abnormalities after gluten elimination [3,4].
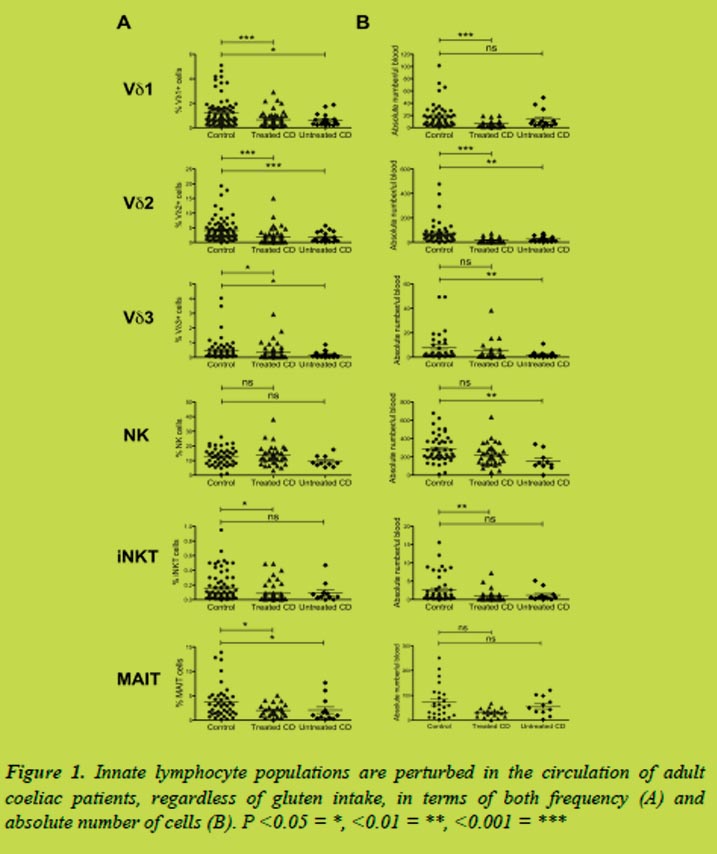
Analysis of innate lymphocytes in the gut also showed that coeliac patients have significantly different profiles when compared to control patients (Figure 2). Differences were also observed between epithelial and lamina propria compartments of the gut. The gut epithelium showed a significantly elevated frequency of Vδ1 cells, but not Vδ2 or Vδ3 cells, while NK, iNKT and MAIT cell populations were reduced.
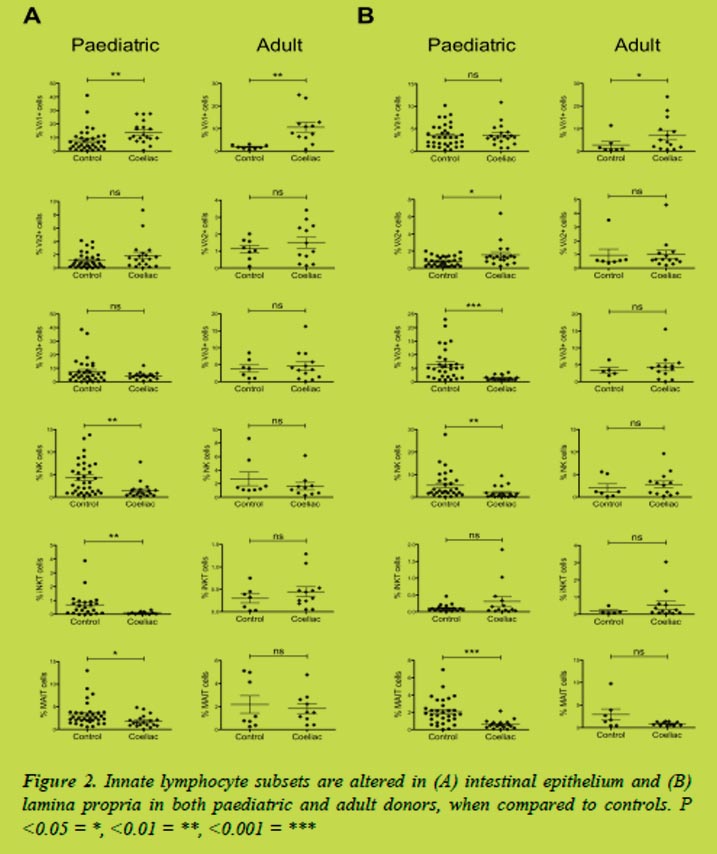
Further to our phenotypic analyses, we noted that CD56 was strongly downregulated in the coeliac gut (Figure 3) and not only on NK cells, as previously reported [5,6], but also on NT cells and γδ T cells. Fewer cells were CD56 positive, and expression on positive cells was less intense, as shown by MFI analysis.
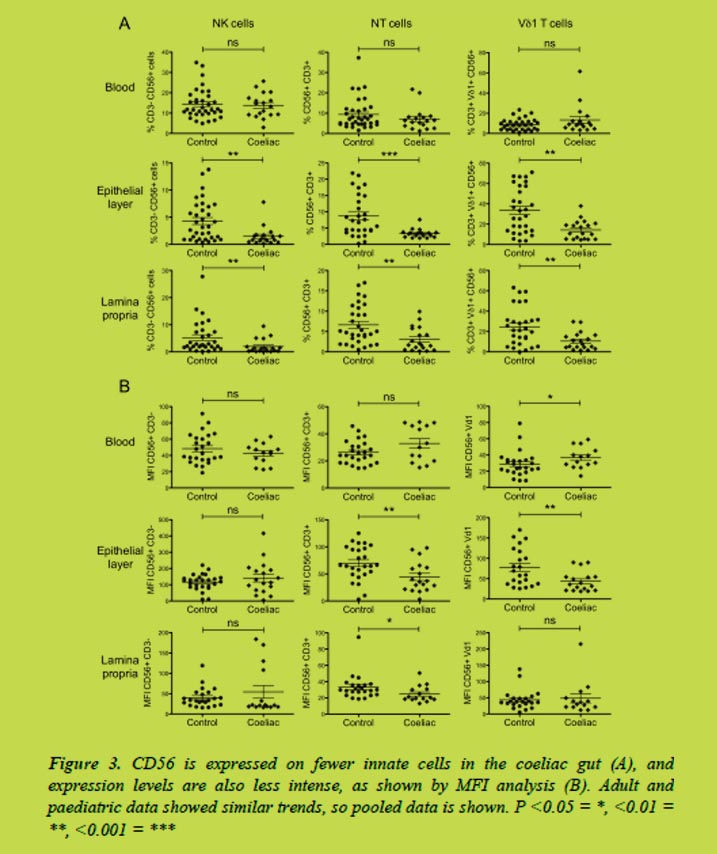
Conclusions
The data shows significant differences between coeliac and control donor innate lymphocyte populations. In adults, these abnormalities were detectable in the blood and persisted even after elimination of gluten from the diet – suggesting that innate immunity may be systemically impaired in these coeliacs despite histological and symptomatic improvement. The preferential increase of the Vδ1 subset within the small intestinal epithelium suggests that these cells in particular may play a role in CD pathogenesis, although more work is required to determine their precise function and whether their elevation in the gut is driven by gluten or merely the result of tissue damage. The observed downregulation of CD56 in the coeliac gut may also have wider implications for cellular function in the gut, and requires further investigation. These results show that most innate lymphocytes are underrepresented in coeliac blood and gut. Whether this observation correlates to impaired innate immunity in the intestine, and whether CD patients would benefit from therapeutic intervention targeting these cells, remains to be seen.
References
1. Ludvigsson JF, Leffler DA, Bai JC, et al. The Oslo definitions for coeliac disease and related terms. Gut 2013; 62: 43-52.
2. O’Keeffe J, Doherty DG, Kenna T, et al. Diverse populations of T cells with NK cell receptors accumulate in the human intestine in health and in colorectal cancer. Eur J Immunol 2004; 34: 2110-2118.
3. Bhagat G, Naiyer AJ, Shah JG, et al. Small intestinal CD8+ TCRgammadelta+ NKG2A+ intraepithelial lymphocytes have attributes of regulatory cells in patients with celiac disease. J Clin Invest 2008; 118(1): 281-93.
4. Kutlu T, Brousse N, Rambaud C, et al. Numbers of T cell receptor (TCR) alpha beta+ but not of TCR gamma delta+ intraepithelial lymphocytes correlate with the grade of villous atrophy in coeliac patients on a long term normal diet. Gut 1993; 34: 208-214.
5. Cseh Á, Vásárhelyi B, Szalay B, et al. Immune phenotype of children with newly diagnosed and gluten-free diet-treated celiac disease. Dig Dis Sci 2011; 56(3): 792-8.
6. Calleja S, Vivas S, Santiuste M, et al. Dynamics of non-conventional intraepithelial lymphocytes-NK, NKT, and γδ T-in celiac disease: relationship with age, diet, and histopathology. Dig Dis Sci 2011; 56(7): 2042-9.
6 Antibodies - Useful tools in gluten detection and coeliac disease diagnosis
6.1 INRA-PQQ3B4: an antibody that binds all gliadins and glutenin subunits
Olivier Tranquet, Benoit Lépicier, Colette Larré, Sandra Denery
INRA, UR1268 Biopolymers, Interactions, Assemblies, Nantes, France
Introduction
Gluten quantification in food mainly lays onto two monoclonal antibodies (mAbs): the 401/21 produced by Skerritt in 1990 [1] and the R5 [2].
Both of them target omega gliadins which are still extractable after heat treatment. Compared to Skerritt’s mAb, the R5 mAb also enables the detection of gluten from rye and barley [3]. In 2008 Codex Alimentarius recommended the R5 mAb associated with the so-called “Mendez cocktail” [4]. But these methods still have some weaknesses: they do not recognise all gliadins and all glutenin subunits (GS), they are sensitive to gluten composition and conversion factors must be applied for total gluten quantification. These points lead to discrepancy between the assays [5] and inaccurate quantitative results [6]. Wieser and Koehler [7] and van Eckert et al. [8] suggested that an antibody or a mixture of antibodies that recognises gliadins and GS to similar degrees might be the next step toward a reliable method.
We explored our antibody library dedicated to food components [9] with the aim to find an antibody able to react with the different gliadins and GS classes [10].
Materials and methods
Purified gliadins and glutenins subunits.
Gliadins were extracted from wheat flour (cv. Hardi) using a sequential procedure. The different gliadin classes (α, β, γ, ω2, and ω5), LMW-GS and HMW-GS were further purified using several chromatography steps [11-13]. Gliadins from the Prolamin Working Group were extracted from Neogen kit (Veratox for Gliadin R5, Neogen, Lansing, USA).
Antibodies
PQQ3B4 mAb was generated by immunisation of mice with a synthetic peptide, YQPQQPFPQ, according to standard procedures and selected by indirect ELISA screening on total gliadins extract. MAbs 401/21 and R5 were taken from commercial kits (Diffchamb S.A., France). The reactivity of the antibodies towards the different gliadins and GS was assessed by indirect ELISA as described in Battais et al. [11] for sample preparation and coating. For the ELISA sandwich based on PQQ3B4 mAb, purified mAb for coating and the peroxidase conjugated mAb for revelation were both used at 1μg/mL.
Production of purified and conjugated PQQ3B4 mAb
In order to reach a highly concentrated supernatant as an alternative to production in ascites fluids, PQQ3B4 hybridoma was adapted in a high cell-density in vitro system (CeLLine-350, Sartorius, Goettingen, Germany). MAb purification was performed in two steps: first, calf IgG from cell culture medium were removed by affinity chromatography on Protein G (1mL cartridge, Pierce, Rockford, USA), then PQQ3B4 mAb was purified by thiophilic interaction chromatography (HiTrap IgM, GE Healthcare, Uppsala, Sweden). IgM contents in cell culture supernatant or in purified fractions were determined with Mouse IgM ELISA quantitation assay (Euromedex, Strasbourg, France). Enzyme conjugation to purified antibody was made with EZ-Link Plus Activated Peroxidase Kit according to manufacturer instructions (Pierce, Rockford, USA).
Results and discussion
Within our collection, 17 antibodies displaying reactivity towards purified gliadins and GS classes were retained. They came from 6 different immunisation programs with synthetic peptides or purified repeated domain or a whole gluten fraction. Their reactivity to purified wheat gliadins and GS were determined in indirect ELISA [10].
Among these candidates, the PQQ3B4 mAb appeared of particular interest because it displayed a broad reactivity to gliadins and GS (Figure 1) contrasting with the Skerritt’s and the R5 mAbs which were more selective.
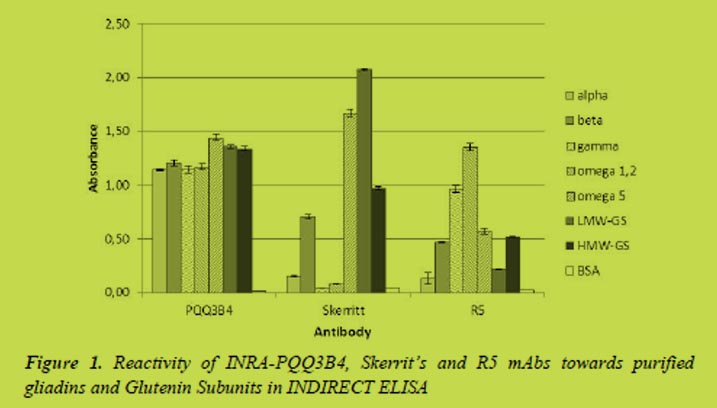
The Skerritt’s mAb was first described to mainly bind to GS and ω-gliadins [14], In our experiment we specify that it was more reactive to LMW-GS than HMW-GS and only with ω5-gliadins. Contrasting with van Eckert description [8], no reactivity towards γ-gliadins was noted in our experiment. Moreover, reactivity was also detected towards α/β gliadins with a stronger binding to β- than to α-gliadins. On the other hand the R5 mAb recognised all gliadins and GS but with different level of intensity. The stronger reactivity was obtained with ω2- and γ-gliadins, a mild reactivity was observed with β-, ω5-gliadins and HMW-GS, whereas α-gliadins and LMW-GS were only weakly bound. The PQQ3B4 mAb here presented is quite different because first it was able to bind to all gliadins and GS classes and moreover its reactivity was equivalent towards all gliadins and GS classes. This mAb might be useful in gluten determination and its ability to be handled in a sandwich ELISA should be evaluated. The isotype characterisation of INRA-PQQ3B4 revealed that it was an IgM and it is well-known that assay development with such isotype is sometimes tricky.
PQQ3B4 hybridoma was adapted in high density in vitro flask. This system enabled the production of high concentration cell culture supernatant compared to conventional flask (160 μg/mL vs 4 μg/mL). Then a purification protocol based on thiophilic interaction has been developed. 5 mg of mAb were purified with a purification yield of 51% (on the basis of four different purifications). 2 mg of purified PQQ3B4 were conjugated to horseradish peroxidase. Neither purification nor conjugation affected the PQQ3B4 activity and specificity (data not shown). Finally a sandwich assay was developed with purified and peroxidase-conjugated PQQ3B4 mAb.
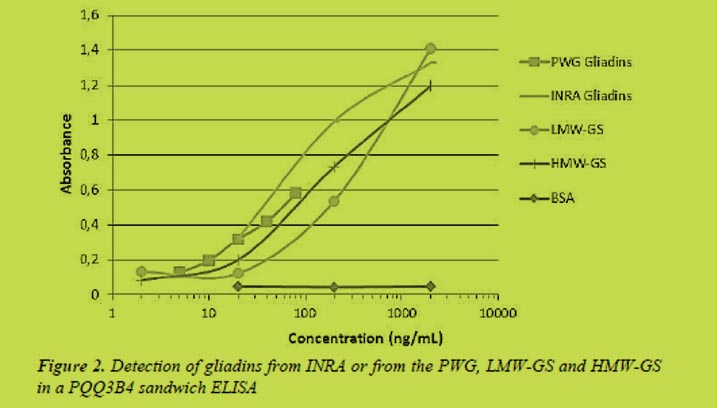
Both gliadins and GS were detected in the PQQ3B4 sandwich ELISA (Figure 2). Whatever their origin, in-house or from the Prolamin Working Group (PWG), gliadins were equivalently recognised with a LOD of 10 ng/mL. However in contrast to indirect ELISA, where purified gliadins classes were recognised at the same intensity than LMW- and HMW-GS, in the sandwich ELISA GS were less recognised than gliadins (LOD at 20 and 30 ng/mL for HMW-GS and LMW-GS resp.).
In view of the broad reactivity of PQQ3B4 it should be reasonably hypothesised that this mAb cross-react with several sequences on gliadins and GS. In sandwich ELISA two epitopes must be bound. The number and the position of the recognised epitopes as well as the affinity of the mAb for each epitopes affect more the sandwich ELISA than the indirect ELISA.
Conclusion
With its broad reactivity to all gliadins and GS the PQQ3B4 mAb might address some drawbacks of the actual available assays based on more selective antibodies. Its IgM isotype, generally associated with a lower affinity than IgG, may explain its ability to react with a wide range of sequences. PQQ3B4 mAb probably tolerate several amino acid substitutions into its epitopes. Besides its pentameric structure and so its ten binding sites may lead to a high avidity towards repeated epitopes as those found into prolamins.
Acknowledgments
We thank Julie Chabauty and Julie Le-Luhant for their technical assistance. This work was funded by INRA-Transfert.
References
1. Skerritt JH, Hill AS. Monoclonal-antibody sandwich enzyme immunoassays for determination of gluten in foods. J. Agric. Food Chem. 1990; 38: 1771-1778.
2. Valdes I, Garcia E, Llorente M, et al. Innovative approach to low-level gluten determination in foods using a novel sandwich enzyme-linked immunosorbent assay protocol. Eur. J. Gastroenterol. Hepatol. 2003; 15: 465-474.
3. Thompson T, Mendez E. Commercial Assays to Assess Gluten Content of Gluten-Free Foods: Why They Are Not Created Equal. J. Am. Diet. Assoc. 2008; 108: 1682-1687.
4. ALINORM 08/31/26, Appendix III, 2008. Draft revised codex standard for foods for special dietary use for persons intolerant to gluten. Joint FAO/WHO Food Standards Programme. Codex Alimentarius Commission WHO, Rome.
5. Allred LK, Ritter BW. Recognition of Gliadin and Glutenin Fractions in Four Commercial Gluten Assays. J. AOAC Int. 2010; 93: 190-196.
6. Seilmeier W, Wieser H. Comparative investigations of gluten proteins from different wheat species - IV. Reactivity of gliadin fractions and components from different wheat species in a commercial immunoassay. Eur. Food Res. Technol. 2003; 217: 360-364.
7. Wieser H, Koehler P. Is the calculation of the gluten content by multiplying the prolamin content by a factor of 2 valid? Eur. Food Res. Technol. 2009; 229: 9-13.
8. van Eckert R, Bond J, Rawson P, et al. Reactivity of gluten detecting monoclonal antibodies to a gliadin reference material. J. Cereal Sci. 2010; 51: 198-204.
9. Tranquet O, Echasserieau V. INRA - Antibody Collection dedicated to food components. 2010; http://www.angers-nantes.inra.fr/angers_nantes/plates_ formes_et_plateaux_techniques/plateau_de_production_d_anticorps_collection_anticorps_cepia/collection_anticorps_cepia.
10 Tranquet O, Larré C, Denery-Papini S. Selection of a monoclonal antibody for detection of gliadins and glutenins: A step towards reliable gluten quantification. J. Cereal Sci. 2012; 56: 760-763.
11. Battais F, Pineau F, Popineau Y, et al. Food allergy to wheat: identification of immunogloglin E and immunoglobulin G-binding proteins with sequential extracts and purified proteins from wheat flour. Clin. Exp. All. 2003; 33: 962-970.
12. Popineau Y, Leguerroue JL, Pineau F. Purification and characterization of omega-gliadin components from common wheat. Lebensmittel-Wissenschaft & Technologie 1986; 19: 266-271.
13. Popineau Y, Pineau F. Fractionation of wheat gliadins by ion-exchange chromatography on SP Trisacryl-M. Lebensmittel-Wissenschaft & Technologie 1985; 18: 133-135.
14. Hill A, Skerritt JH. Monoclonal antibody based two-site enzyme immunoassays for wheat gluten proteins. 1. Kinetic characteristics and comparison with other ELISA formats. Food Agric. Immunol. 1989; 1: 147-160.
6.2 Antibody based methods for coeliac disease diagnosis
Thomas Mothes, Johannes Wolf
Institute of Laboratory Medicine, Clinical Chemistry and Molecular Diagnostics,
Medical Faculty of the University and University Hospital, Leipzig, Germany
Introduction
Diagnosing coeliac disease (CD) may be a lengthy and time-consuming process. Typically, gastrointestinal or other rather non-specific symptoms cause the assay of antibodies in the blood. If the concentration of antibodies is increased, a biopsy is performed and the duodenal histology evaluated. Mucosal damage such as villous atrophy is regarded as strong evidence for CD. However, often there are only minor changes like crypt hyperplasia or increased number of intraepithelial lymphocytes. Sometimes, HLA analyses are necessary to strengthen the diagnosis. In any case, there should be an improvement of the patient under a gluten-free diet.
Until recently, antibody assays did not have a diagnostic value per se, but they only prompted a subsequent biopsy, if increased. According to the new ESPGHAN guidelines, CD is defined as a variable combination of gluten-dependent clinical mani-festations, concentration of CD-specific antibodies, HLA-DQ2 or HLA-DQ8 haplotypes, and enteropathy [1]. Thus, antibodies are nowadays already included into the definition.
Preconditions for the development of reliable antibody assays
It is known already since 1957 that CD is associated with the appearance of antibodies in the blood. The first antibody species detected was those against gliadins (anti-Gli). This was shortly after the discovery of wheat gliadin (Gli) as causative agent of CD [2,3] and after description of villous atrophy [4]. Why the long time before antibodies were recognised as reliable diagnostic tools?
Development of sensitive and precise assay techniques
The first assays were complement fixation tests [5], Ouchterlouny techniques [6], fluorescent immunosorbent tests using Gli coated gel beads [7] or immunofluorescent assays using Gli coated human erythrocytes [8]. Also, binding to reticulin fibres pre-treated with gliadin was used for detection of Gli antibodies (anti-Gli) [9]. The first ELISA-technique for assay of anti-Gli was described in 1979 [10].
Definition of the antigens
Antigens for the antibody assays had to be defined, isolated, purified, synthesised or produced as recombinant proteins or peptides. It was only in 1997 when tissue trans-glutaminase (tTG) was identified as the autoantigen [11]. There is still an ongoing discussion which antigen conformation is best suited for the detection of autoantibodies against tTG (anti-tTG) [12]. It was also investigated if antibodies to neoepitopes (formed in part by tTG and in part by gliadin linked to tTG) may have a higher diag-nostic value [13,14].
Further, it was found that native Gli (nGli) is not the optimum antigen for detection of anti-Gli. Enzymatic activity of tTG converts nGli into deamidated Gli (dGli). This is an important precondition for reactivity of antibodies of CD patients. The synthetic QE substituted peptides PLQPEQPFP, derived from PLQPQQPFP of ω-secalin [15], and PEQLPQFEE, derived from PQQLPQFEE of α/β-gliadin [16], were found to be excellent antigens [17].
Definition of the disease
Nowadays antibodies can be measured with very high precision. But what is the dis-ease to be correlated with? CD still remains ill-defined [18]. CD may clinically impose as a chameleon [19]. The enteropathy represents an important part of the definition. However, difficulties in adequate evaluation of the biopsy material are well-known [20-22].
Until recently, increased antibody concentrations were not regarded as the disease it-self, but only seen as markers. An increased antibody concentration in the absence of other features of CD was normally not taken as a reason to treat a patient. In this case, an antibody result was regarded as „false-positive“. However, the new guidelines [1] already include the antibodies. So, by definition, are false-positives and -negatives still possible? Problems may not always be due to so-called wrong antibody results but also due to the difficulties in the definition of CD.
1. Non-coeliac gluten sensitivity
This entity belongs to the gluten-related disorders but is different from CD. In non-CD gluten sensitivity, patients have a gluten-triggered disease but no enteropathy or signs of CD autoimmunity [18]. In non-CD gluten sensitivity, anti-tTG and antibodies against dGli (anti-dGli) are not increased. There is only an increase in anti-nGli [23].
2. Potential CD
According to the new guidelines, potential CD is defined by the presence of CD-spe-cific antibodies and compatible HLA but without histological abnormalities in duode-nal biopsies. The patient may or may not have symptoms and signs and may or may not develop a gluten dependent enteropathy later [1]. There is no mucosal damage and even the density of intraepithelial lymphocytes is not increased. Literally taken, there should be no patients, who are false-positive for antibodies (provided they bear the ap-propriate HLA-type).
Potential CD can be found in more than 10% of patients with autoimmune diabetes [24]. Patients with potential CD mostly have no symptoms or suffer by light symp-toms, often transient, that in many cases resolve even on a gluten-containing diet. Some of the children with potential CD later develop villous atrophy [25].
3. Fluctuating antibodies
Fluctuating antibodies are high at the moment of the first measurement, but become again negative later. To be sure that the patient is really antibody positive a “wait and see strategy” should be followed. In symptomless children with a positive CD serol-ogy, the decision of performing an intestinal biopsy should be preceded by a period of repeated serological testing. Fluctuating antibodies are not regarded as false positives but seen as a result of a CD-type response influenced by regulatory immune events [26].
4. Accuracy of the histological assessment
Histological evaluation of the duodenal tissue is strongly observer dependent and, therefore, not without failure [20-22]. Antibody tests are normally rated according their correlation with histology. A positive antibody test would be regarded as false-positive if the histology is false negative.
The antibody diagnostic arsenal
IgA-antibodies against endomysium (IgA-EmA), IgA-anti-tTG and IgG-anti-dGli have a more or less comparable diagnostic performance. EmA are still considered as the best by some experts, although their measurement is very elaborate, namely by im-munofluorescence. EmA are suggested by the ESPGHAN [1] in case of high IgA-anti-tTG titres to decide if an intestinal biopsy may be avoided. IgA-anti-tTG represent the undisputed classic antibodies. IgG-anti-dGli are still relatively new. Meanwhile there are many commercially available tests for measurement of IgG-anti-dGli, but it is only the GAF(3X)-test, in which the epitope sequence is disclosed. This is a repetitive trimer of the 2 nonapeptides mentioned above. These peptides are called gliadin analogous fusion peptides (GAF-peptides) and were used in the following assays. IgA-anti-tTG and IgG-anti-dGli can be measured very simply in automated ELISA sys-tems. The assays have a quite good sensitivity and specificity above 90 or even 95 per cent.
For special questions it may be useful to stain for tTG-related mucosal IgA deposits. Such deposits are predictive of forthcoming overt CD with villous atrophy. They may be regarded as a marker of developing CD and CD latency, and a promising diagnostic tool in cases with low grade enteropathy [27]. The technique is highly elaborate and needs tissue snap frozen in liquid nitrogen and stored at -70°C until use.
The diagnostic performance of IgG-anti-dGli
We tested the diagnostic performance of antibodies against GAF-peptides (anti-GAF) and compared it with of anti-tTG, EmA and anti-nGli.
GAF(3X) is a much better antigen for anti-Gli than nGli. Interestingly, the IgG-anti-GAF performs better than IgA-anti-GAF. IgG-anti-GAF is non-inferior to IgA-anti-tTG [28,29].
IgA-anti-tTG are not able to detect CD in case of selective IgA-deficiency (sIgAD). Increased concentrations of IgG-anti-tTG are informative only after estimation of total IgA. However, IgG-anti-GAF specifically indicate CD irrespective of total IgA con-centration [30].
For very young children, the assay of anti-nGli is still sometimes recommended [31]. However, our results do not support the measurement of anti-nGli for diagnosis of CD in children up to 2 years of age. IgA-anti-tTG and EmA and IgG-anti-GAF perform better [32].
Diagnosis without biopsy?
The new ESPGHAN guidelines [1] asked, if the diagnosis of CD may be made without duodenal biopsies. For this, a very high concentration of IgA-anti-tTG (above the 10 x cut-off level) was proposed as an important condition. Anti-dGli were not included into these considerations. It was concluded, that the performance of the guidelines in clinical practice should be evaluated prospectively.
This year we have started a prospective multicentre trial of antibody diagnostics in paediatric CD (AbCD-trial) [33]. Eleven trial centres from 5 European countries are participating and we expect about 900 patients with suspected CD within 2 years. The aims of this trial are to establish a diagnostic cascade in patients with clinical suspicion of CD using antibody tests first and avoiding biopsy in already clear cases. Children and adolescents will be included scheduled for duodenal biopsy as by standard clinical practice with primary aim to confirm (or refute) CD. In the sera of these patients anti-GAF and anti-tTG as well as EmA will be assayed. There will be a reference evalua-tion of the duodenal histology. We hope to be able to define antibody constellations (meaning combinations of different antibodies at enhanced cut-offs) with predictive values so high that a biopsy to confirm the diagnosis is no longer necessary in a large part of patients.
Analysis of retrospective data
We analysed retrospective data of 296 CD and 691 control children. Among these children there were 21 CD patients with sIgAD and 1 patient with common variable immunodeficiency (CVID). Data from 633 patients were already included into recent publications [28-30,32] and data of 354 patients are newly included into the analysis. The patients were from (with the number of newly included children in curly brackets) the Children’s Hospital of the Clinical Centre „Sankt Georg“ Leipzig {234} (Germany), the University Children’s Hospitals Leipzig {91}, München, Tübingen {1}, Giessen {24} (Germany) and Graz {1} (Austria), the Department of Laboratory Medicine of the University Hospital Leuven {1} (Belgium), and the Department of Paediatrics, University Medical Centre Leiden {3} (The Netherlands). Patients were diagnosed and antibodies were tested as described [27,29,31]. Antibody data are shown in Figure 1.
Table 1 summarises positive (PPV) and negative predictive values (NPV) of the 2 main antibody tests under different conditions. Both parameters are strongly dependent on the prevalence (post-test probability) of the disease. PPV increases and NPV decreases with prevalence. According to recent literature, prevalences for calculation of PPV seem often highly overestimated. In our calculations for PPV and NPV, prevalences of 10% and 50% were assumed, respectively.
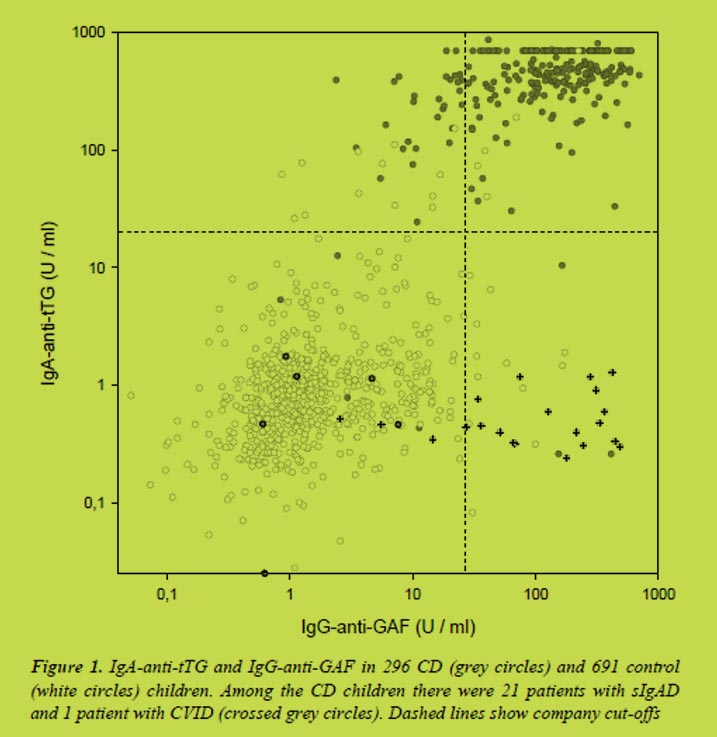
A high PPV (> 0.95) can only be obtained for definitions of positives (5), (7), (8), and (9). From these, only definitions (8) and (9) secure sensitivities > 85%. The high NPV (at specificities > 0.95) of definitions (4) and (10) should be noted.
What will be the advantage of a prospective study? Our suspicion is that, in the retro-spective analysis, in few cases we have correlated true positive antibody data with false-negative histologies and vice versa. Our hope is, to avoid inadequate histological assessments in a prospective study by careful second or third blind inspection of the biopsies. Further, defined selection criteria of a prospective study should minimise se-lection biases.
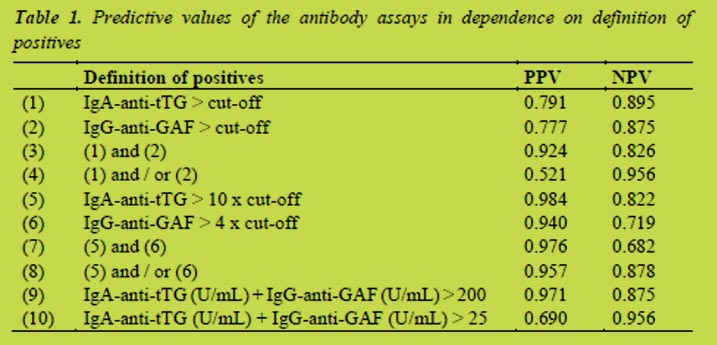
Cut-offs as suggested by the manufacturer of the test kits (20 U/mL for IgA-anti-tTG and 25 U/mL for IgG-anti-GAF). PPV and NPV: Positive and negative predictive values. For calculation, prevalences of 10% or 50% were assumed, respectively.
Conclusions
To evaluate the performance of an antibody test for the diagnosis of CD it is essential to know which clinical condition has to be diagnosed. Wrong antibody results are not always due to invalid antibody tests but may also be due to misdiagnosis. Nowadays a higher weight is given to antibody assays than ever before. The new guidelines even include antibodies into the definition of CD. This may make further correlation of se-rology with histology difficult.
Several reliable antibody tests are available, among them IgG-anti-dGli, and the com-bination of tests may lead to higher predictive values than application of single tests. From retrospective data, ranges of antibody concentrations with very high PPV and NPV can be defined, where a biopsy would no longer be necessary for confirmation of diagnosis. However, in some cases the results of antibody tests will remain doubtful (sIgAD, early stage CD, potential CD). These retrospective results need to be verified prospectively.
Acknowledgments
The contributions of Bossyut X (Dept Lab Med of the Univ Hosp Leuven), Dähnrich C (EUROIMMUN Lübeck), Flemming G (Univ Children’s Hosp Leipzig), Hasencle-ver D (Inst Med Informat Statist Epidemiol, Univ. Leipzig), Hauer AC (Univ Children’s Hosp Graz), Koletzko S (Univ Children’s Hosp München), Laas MW (Univ Children’s Hosp Dresden), Mearin L (Dept Paediat, Univ Med Centre Leiden), Petroff D (Coord Centre Clin Trials Leipzig), Prause C (Inst Lab Med, Univ Hosp Leipzig), Richter T (Children’s Hosp Clin Centre „Sankt Georg“ Leipzig) Schlumberger W (EUROIMMUN Lübeck), Stern M (Univ Children’s Hosp Tübingen), Tonutti E (Allergy & Immunopathol Unit, Azienda Ospedal-Universit “San Maria della Misericordia” Udine), Uhlig HH (Transl Gastroenterol Unit, Exp Med of the Univ, John Radcliffe Hosp Oxford), Vermeersch P (Dept Lab Med of the Univ Hosp Leuven), Villalta D (Allergy & Immunol Unit, Azienda Ospedal “San Maria degli Angeli” Pordenone), Zimmer K-P (Univ Children’s Hosp Gießen) in sample acquisition and evaluation are gratefully acknowledged.
References
1. Husby S, Koletzko S, Korponay-Szabó IR, et al. European Society for Pediatric Gastroenterology, Hepatology, and Nutrition guidelines for the diagnosis of coeliac disease. J Pediatr Gastroenterol Nutr 2012; 54: 136-60.
2. Dicke WK. Coeliakie: een onderzoek naar de nadelige invloed van sommige graansoorten op de lijder aan coeliakie. MD Thesis University of Utrecht 1950.
3. Paulley JW. Observations on the aetiology of idiopathic steatorrhoea. Jejunal and Lymph node biopsies. Brit Med J 1954; 173: 1318-1321.
4. Sakula J, Shiner M. Coeliac disease with atrophy of the small intestine mucosa. Lancet 1957; ii: 876-877.
5. Berger E. Cöliakie und Antikörper gegen Nahrungsmittel-Antigene. Annales Paediatrici 1957; 188: 297-300.
6. Pokorná M, Sourek J, Svejcar J. Die Bedeutung der Präzipitine gegenüber Gliadin im Serum von Kindern mit Cöliakie. Helv Paediatrica Acta 1963; 393-397.
7. Bürgin-Wolff A, Hernandez R, Just M. A rapid fluorescent solid-phase method for detecting antibodies against milk proteins and gliadin in different immunoglobulin classes. Experientia 1972; 28: 119-120.
8. Stern M, Grüttner R. Gliadinantikörper in der Immunfluoreszenz. Über den Einsatz eines immunologischen Tests in der Diagnostik und Verlaufskontrolle der Zöliakie, im Familienscreening und in der Erforschung der gastrointestinalen Verarbeitung von Nahrungsantigenen. Kinderärztl Prax 1981; 49: 9-19.
9. Unsworth DJ, Manuel PD, Walker-Smith JA, et al. New immunofluorescent blood test for gluten sensitivity. Arch Dis Child 1981; 56: 864-868.
10. Huff JC, Weston WL, Zirker DK. Wheat protein antibodies in dermatitis herpeti-formis. J Invest Dermatol 1979; 73: 570-574.
11. Dieterich W, Ehnis T, Bauer M, et al. Identification of tissue transglutaminase as the autoantigen of celiac disease. Nat Med 1997; 3: 797-801.
12. Lindfors K, Koskinen O, Kurppa K, et al. Serodiagnostic assays for celiac disease based on the open or closed conformation of the autoantigen, transglutaminase 2. J Clin Immunol 2011; 31: 436-442.
13. Basso D, Guariso G, Bozzato D, et al. New screening tests enrich anti-transgluta-minase results and support a highly sensitive two-test based strategy for celiac disease diagnosis. Clin Chim Acta 2011; 412: 1662-1667.
14. Matthias T, Pfeiffer S, Selmi C, et al. Diagnostic challenges in celiac disease and the role of the tissue transglutaminase-neo-epitope. Clin Rev Allerg Immunol 2010; 38: 298-301.
15. Hull GA, Halford NG, Kreis M, et al. Isolation and characterisation of genes en-coding rye prolamins containing a highly repetitive sequence motif. Plant Mol Biol 1991; 17: 1111-1115.
16. Okita TW, Cheesbrough V, Reeves CD. Evolution and heterogeneity of the α/β type and γ-type gliadin DNA sequences. J Biol Chem 1985; 260: 8203-8213.
17. Schwertz E, Kahlenberg F, Sack U, et al. A new serologic assay based on gliadin-related nonapeptides as highly sensitive and highly specific diagnostic aid in celiac disease. Clin Chem 2004; 50: 2370-2375.
18. Mäki M. Lack of consensus regarding definitions of coeliac disease. Nat Rev Gas-troenterol Hepatol 2012; 9: 305-306.
19. Fasano A. Celiac Disease - How to handle a clinical chameleon. N Engl J Med 2003; 348: 2568-2570.
20. Collin P, Kaukinen K, Vogelsang H, et al. Antiendomysial and antihuman recom-binant tissue transglutaminase antibodies in the diagnosis of coeliac disease: a biopsy-proven European multicentre study. Eur J Gastroenterol Hepatol 2005; 17: 85-91.
21. Weir DC, Glickman JN, Roiff T, et al. Variability of histopathological changes in childhood celiac disease. Am J Gastroenterol 2010; 105: 207-212.
22. Arguelles-Grande C, Tennyson CA, Lewis SK, et al. Variability in small bowel histopathology reporting between different pathology practice settings: impact on the diagnosis of coeliac disease. J Clin Pathol 2012; 65: 242-247.
23. Volta U, Tovoli F, Cicola R, et al. Serological tests in gluten sensitivity (nonceliac gluten intolerance). J Clin Gastroenterol 2012; 46: 680-685.
24. Franzese A, Iafusco D, Spadaro R, et al. Potential celiac disease in type 1 diabetes. A multicenter study. Diabetes Res Clin Pract 2011; 92: 53-56.
25. Tosco A, Salvati VM, Auricchio R et al. Natural history of potential celiac disease in children. Clin Gastroenterol Hepatol 2011; 9: 320-325.
26. Lionetti E, Castellaneta S, Pulvirenti A, et al. Prevalence and natural history of potential celiac disease in at-family-risk infants prospectively investigated from birth. J Pediatr 2012; 161: 908-914.
27. Korponay-Szabo IR, Halttunen T, Szalai Z, et al. In vivo targeting of intestinal and extraintestinal transglutaminase 2 by coeliac autoantibodies. Gut 2004; 53: 641-648.
28. Prause C, Ritter M, Probst C, et al. Antibodies against deamidated gliadin as new and accurate biomarkers of childhood coeliac disease. J Ped Gastroenterol Nutr 2009; 49: 52-58.
29. Prause C, Richter T, Koletzko S, et al. New developments in serodiagnosis of childhood celiac disease: assay of antibodies against deamidated gliadin. Ann N Y Acad Sci 2009; 1173: 28-35.
30. Villalta D, Tonutti E, Prause C, et al. IgG-antibodies against deamidated gliadin peptides for diagnosis of celiac disease in patients with IgA-deficiency. Clin Chem 2010; 56: 464-468
31. Lagerqvist C, Dahlbom I, Hansson T, et al. Antigliadin immunoglobulin A best in finding celiac disease in children younger than 18 months of age. J Pediatr Gastroenterol Nutr 2008; 47: 428-435.
32. Richter T, Bossuyt X, Vermeersch P, et al. Determination of IgG and IgA antibodies against native gliadin is not helpful for the diagnosis of coeliac disease in children up to 2 years old. J Pediatr Gastroenterol Nutr 2012; 55: 21-25.
33. https://faustino.imise.uni-leipzig.de/abcd/
7 Current developments concerning gluten legislation – Statements by governmental organisations, representatives from industry and guests
7.1 Gluten analysis and legislation – A North American view
Michael Abbott1
1 Bureau of Chemical Safety, Food Directorate, Health Canada, Ottawa, Canada
Introduction
It is estimated that 1 in 133 people in Canada are affected by coeliac disease (CD) [1]. Health Canada considers the issue of CD to be a high priority public health issue.
This manuscript will provide an overview of legislation surrounding the use of gluten-free claims on foods in Canada and the United States as well as summarising results from some recent studies.
Discussion
Gluten-Free in Canada
In Canada the food regulatory framework is made up of the Canadian Food and Drugs Act (FDA) and the Canadian Food and Drug Regulations (FDR). The FDA is a relatively short document, with general, overarching provisions regarding food and drugs sold in Canada. The FDR are more detailed, specific rules, broken into different sections which each deal with different types of foods.
Recently the FDR were amended in order to enhance the labelling of food allergens, gluten sources and added sulphites in prepackaged foods. These amendments eliminated certain exemptions in order to ensure that when intentionally added food allergens, gluten sources or sulphites were present in a prepackaged food they would always be shown on the label. These changes, which came into effect on August 4, 2012, were designed to ensure that people with food allergies or CD always had the information they needed in order to make informed choices about which foods to consume.
As noted, parts of these amendments were specific to the labelling of gluten sources. These new rules mean that whenever gluten is present in a food as an ingredient or component of an ingredient, the gluten source (wheat, rye, barley, triticale, oats) must always be declared. This eliminates some gaps, particularly with respect to certain ingredients which are exempt from component declaration under the Food and Drugs Regulations, but which could contain gluten sources as a component (s).
In Canada regulations governing the use of gluten-free claims on foods were first introduced in 1995, in order to help protect people with CD and help them identify safe food choices. These regulations are housed in a section of the FDR, Section 24, which is reserved for foods for special dietary use. These are defined as foods which are specially processed or formulated to meet the particular requirements of a person i)-in whom a physical or physiological condition exists as a result of disease, disorder or injury or ii) for whom a particular effect, including but not limited to weight loss, is to be obtained by a controlled intake of foods. The gluten-free regulations, Section B.24.018 of the FDR outline the rules for making a gluten-free claim on foods in Canada. At the same time that the enhanced labelling regulations for food allergen and gluten sources and added sulphites were enacted, an update was made in the gluten-free regulations. The current regulation is shown in Figure 1. The previous version of the gluten-free regulations only permitted a gluten-free claim if a food was free from wheat, rye, barley, oats and triticale “or any part thereof”. The new version of the gluten-free regulations is specific to the “gluten protein, modified protein or protein fraction”. This change means that ingredients which are derived from a gluten source but which have been specially processed to remove gluten, for example a highly purified wheat starch, may now be used in the manufacture of gluten-free foods.
20 ppm threshold for gluten-free
Neither the old version of the gluten-free regulations, nor the newer version specifies a specific threshold level for gluten below which a gluten-free claim can be made. For many years thresholds for gluten were limited to what analytical methods for gluten were capable of detecting. More recently methods became available which can reliably detect gluten in the low ppm range. In 2008 Codex amended its threshold for gluten-free foods to no more than 20 ppm of gluten. Prior to this the Codex threshold was set at 200 ppm of gluten. Health Canada also investigated the potential to set a threshold level for gluten in gluten-free foods. While no threshold level is written into the regulations, the purpose of Section B.24.018 is to protect the health and safety of individuals who must follow a gluten-free diet for health reasons. It follows that if a food is determined to be protective of the health of people with CD, and meets the other requirements of Division 24 of the FDR (is specially processed and formulated), such a food should be able to use the claim “gluten-free”, as long as it is done in a way that is truthful and not misleading.
In June 2012, based on a thorough review of the scientific literature Health Canada scientists concluded that “Based on the available scientific evidence, Health Canada considers that gluten-free foods, prepared under good manufacturing practices, which contain levels of gluten not exceeding 20 ppm as a result of cross-contamination, meet the health and safety intent of B.24.018 when a gluten-free claim is made” [2].
Pure Oats
In 2007 Health Canada published a position paper entitled “Celiac disease and the Safety of Oats”. This position paper was the result of a review of scientific studies which looked at the consumption of pure oats, uncontaminated with wheat, rye or barley, in specified quantities by people with CD. Based on these studies, Health Canada concluded that the majority of people with CD can tolerate moderate amounts (50 - 70 g/day for adults and 20 - 25 g/day for children) of pure oats, uncontaminated with other cereal grains such as wheat, barley and rye. The benefits of pure oats included improved compliance with the gluten-free diet, increased palatability, increased source of fiber and increased variety of choices to what is a highly restricted diet. At the same time it was noted that some people with CD in the studies did not tolerate even pure oats and that this requires further investigation and cautious progress. Health Canada advised that clinical follow-up of those individuals who consume pure oats in their diet is advisable, and that people with CD should consult physicians, dieticians or other health practitioners prior to introducing pure oats to their diet.
The Codex definition of gluten free includes oats in the list of gluten-containing grains but also notes “Oats can be tolerated by most but not all people who are intolerant to gluten. Therefore, the allowance of oats that are not contaminated with wheat, rye or barley in foods covered by this standard may be determined at the national level.”
Currently in Canada even pure oats, or foods produced using pure oats, are not allowed to make a gluten-free claim. This is because oats are included in the list of gluten containing grains in Section B.01.010 which is referenced by the gluten-free regulations. Health Canada is currently investigating options which could allow pure oats, or products made with pure oats, to make a gluten-free claim. Any changes to the current situation would need to account for the health and safety of those individuals who are not tolerant of pure oats.
Gluten-Free in the USA
In August of 2004, the Food Allergen Labeling and Consumer Protection Act of 2004 (Public Law 108-282, Title II) was passed. Part of this act required the USFDA to develop a definition for the term “gluten-free”. In 2007 the FDA outlined a proposed definition for “gluten-free” and solicited feedback. This proposal included a 20 ppm threshold meaning that gluten-free foods would have to contain less than 20 ppm of gluten. The agency based the 20 ppm threshold in part on the available validated methods for gluten and the fact that labelling standards for gluten-free used by many other countries In August of 2011 the FDA gluten-free proposal was reissued and opened for comments. The entire FDA gluten-free proposal is available online [3].
The agency based the proposal, in part, on the available methods for gluten detection, indicating that validated methods could not reliably detect the amount of gluten in a food when the level was less than 20 ppm. It also noted that a threshold of less than 20 ppm also is similar to “gluten-free” labelling standards used by many other countries.
The proposal would allow the use of a gluten-free claim on oats as long as they had less than 20 ppm of gluten in them. It is worth noting that in the absence of a final ruling some products in the US and made with pure oats are already being sold with a gluten-free claim.
Examples of gluten analysis
Health Canada investigated the level of gluten from wheat, rye and barley that is present in samples of oats for sale in Canada. Results of this study were published in 2011 [4] and confirmed that the vast majority of oats in Canada did contain gluten from wheat, rye and barley at levels above 20 ppm.
Health Canada has conducted estimations to determine exposure to gluten from grain-containing foods and foods with grain-derived ingredients (i.e., flour). These estimates take into consideration the various rates of food consumption by different sex and age groups and have concluded that if gluten was present at levels not exceeding 20 ppm, exposure to gluten would remain below 10 mg per day for all age groups studied [2].
Health Canada has also been conducting gluten analysis on gluten-free flours and mixes that would be used by people making foods at home. These results will be used in an attempt to estimate residual gluten exposure in gluten-free diets. This study is not yet completed and results will be published as they become available.
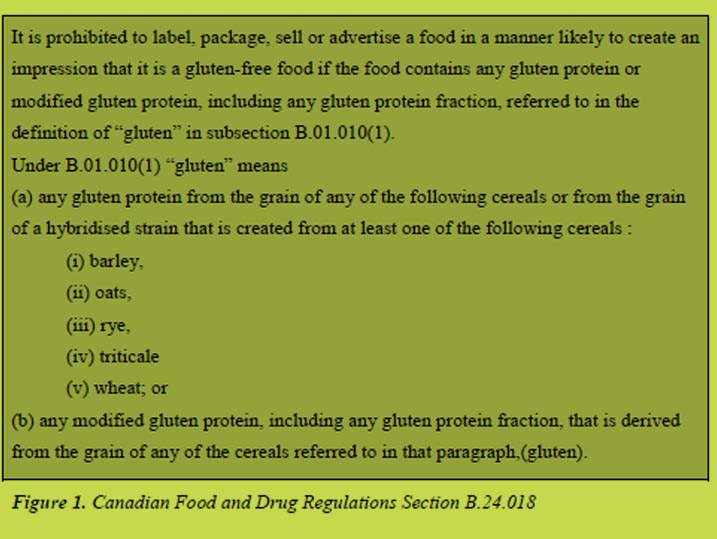
References
1. Canadian Celiac Association website http://www.celiac.ca/index.php/about-celiac-disease-2/symptoms-treatment-cd/
2. Health Canada website Health Canada’s Position on Gluten-Free Claims http://hc-sc.gc.ca/fn-an/securit/allerg/cel-coe/gluten-position-eng.php#fnb4
3. Federal Register, 76, No. 149, 2011, Proposed Rules http://www.gpo.gov/fdsys/pkg/FR-2011-08-03/pdf/2011-19620.pdf
4. Koerner TB, Cleroux C, Poirier C, et al. Gluten contamination in the Canadian commercial oat supply. FAC, 2011, 28 (6): 705-710.
7.2 Current regulatory status in the EU on “gluten free”
Gertrud Granel1, Johan De Meester2
1 Fachverband der Stärke-Industrie e.V., Bonn, Germany
2 Cargill R&D Centre Europe, Vilvoorde, Belgium
Introduction
Applying from 1st January 2012 onwards, Regulation 41/2009, sets compositional and labelling standards for foods claiming to have low gluten content, the allowed claims being “gluten free” and/or “very low gluten.” Gluten free products can be foods specially produced, prepared and/or processed to meet the special dietary needs of people intolerant to gluten, as well as conventional products, but in all cases their gluten content shall not be higher than 20 parts per million (ppm) gluten.
“Very low gluten” claim foods must be specially prepared and/or processed to meet the special dietary needs of people intolerant to gluten, and are foods containing ingredients made from wheat, rye, barley, oats, or their crossbred varieties ingredients that have been specially processed to remove the gluten. Very low gluten food must contain no more than 100 ppm gluten. Very low gluten food may also bear a gluten free claim when meeting the 20 ppm threshold.
The EU legislator is debating a significant modification of the current legislation on food for particular nutritional uses, which will likely result in a transfer of the current regulatory standard for very low gluten and gluten free claims under the scope of another framework EU legislation.
New proposal EU Commission
The new proposal envisages putting an end to the traditional concept of “dietetic food” under Parnuts (regulation for particular nutrition on food intended for infants and young children and on food for special medical purposes) [1]. Main impact will be the way food traditionally under the “Parnuts” category will be regulated, labelled and notified. The most immediate consequence would be that the gluten-free claims would no longer be regulated under Regulation 41/2009 on foods for people intolerant to gluten [2] but would need to be compliant with the provisions of the Health and Nutrition Claims Directive (HNC Directive) [3] which is for healthy people following a nutritional profile.
Sectorial trade associations and coeliac patients societies strongly believe this was not the way forward and have urged the Commission to maintain Regulation 41/2009 concerning the composition and labelling of foodstuffs suitable for people intolerant to gluten. Failing to do so, and adopting the proposal as it stands, would surely fail the Commission’s intention for enhanced clarity and simplification and would have serious consequences.
IDACE and AAF common position
The trade associations IDACE and AAF have formulated the following three common comments :
The HNC Regulation is not the right legislation for addressing the needs of people with particular nutritional requirements.
The proposal will cause confusion among coeliac patients: the HNC Regulation is conceived for healthy people/general population and it is aimed at helping them to remain healthy, and is based on a nutritional profile concept. Whereas the Parnuts legislation is tailored for people with health problems and definitely with specific nutritional needs.
Coeliac patients would have less choice as for the products they could actually buy
The HNC Regulation foresees that only products that have an adequate nutrition profile (in terms of salt, fat and sugar content) can bear a claim. This means that products that currently bear a gluten-free claim, may no longer in the future bear such claim if their fat, sugar and salt content is such that the food is considered to be unsuitable to bear a claim: the rationale behind the HNC Regulation is that in general, a product bearing a claim, whatever that may concern, is considered to be “healthy” and “good for you” by consumers. This would significantly reduce the availability of products for coeliac patients, without any real justification.
Gluten-free under HNC imposes no benefit to ANY category of consumers, and provides misleading messages
IDACE and AAF argued that there is no benefit for coeliac patients in having the gluten-free claim brought under the HNC Regulation. Neither there would be any health benefit in reducing gluten consumption for the entire EU population, including the vast majority that has no gluten intolerance. This is because there is no scientific evidence indicating that such reduction would benefit consumers regardless whether they are gluten intolerant/allergic or not. On the contrary, including the use of the gluten-free claim under the regime of the HNC would induce to believe that high doses of gluten may have the same consequences, health wise than salt, sugar and fat, nutrients whose excessive consumption the HNC Regulation intends to tackle. It is clear, that excessive gluten consumption would only damage coeliac patients.
Last but not least IDACE and AAF warned that the proposal may encourage the increasingly growing trend whereby products that do not normally contain gluten, e.g. tomato sauce cans, have sometimes been marketed with the claim “gluten-free”. Sales of those products apparently raised, as in consumers’ imagination such claim is equal to “healthier”, as stated above. Hence, also non-coeliac patients started buying products bearing those claims. Eventually, those claims were deemed to be misleading, notably in Sweden.
Proposed way out
On 29 February 2012, the European Parliament Committee on the Environment, Public Health and Food Safety (ENVI Committee) voted unanimously to support significant amendments to the draft European Commission Regulation concerning food intended for infants and young children and food intended for special medical purposes.
Significant amendments were proposed, although the EP ENVI Committee members supported the abolition of the concept of Parnuts foods, they considered that foods intended for use in energy-restricted diets for weight reduction should remain within the scope of the proposed Regulation. With regard to foods suitable for people intolerant to gluten, the Committee accepted that they should not be included within the scope of the proposed Regulation.
However, rather than regulating the statements ‘gluten-free’ and ‘very low gluten’ as nutrition claims as provided for within the draft Regulation, the Committee proposed that these statements should be regulated solely by the new Food Information Regulation (EC Regulation 1169/2011) which sets out rules on information to provide on the presence in all foods, of ingredients, such as gluten.
Current regulatory status
On 14th June 2012, the European Parliament adopted its first reading position on the review of Parnuts Framework Directive 2009/39/EC following the earlier vote of 7th June of the Council of the European Union agreeing its general approach to give a mandate to the EU Presidency to negotiate with the European Parliament. The Council will now consider the amendments of the Parliament with a view to adopt its first reading position. The European Parliament has however, indicated it will not be entering into negotiations for a first reading deal. The dossier will therefore, move forward for agreement at second reading under the Cypriot Presidency. It is one of their priorities and an initial Council meeting was planned for 20th July 2012. Work will continue through autumn with the second reading in winter or spring 2013.
Conclusion
It is necessary that the acts pursuant to EU Regulation 1169/2011, transferring the rules on the use of the statements 'gluten-free' and 'very low gluten' as regulated under EU Regulation 41/2009 be completed prior to the application of reviewed Parnuts Framework Directive 2009/39/EC.
References
1. Directive 2009/39/EC of the European Parliament and of the Council of 6 May 2009 on foodstuffs intended for particular nutritinoal uses (recast). OJ L 124, 20.5.2009, pp. 21-29.
2. Commission Regulation (EC) No 41/2009 of 20 January 2009 concerning the composition and labelling of foodstuffs suitable for people intolerant to gluten. OJ L 16, 21.1.2009, pp. 3-5.
3. Regulation (EC) No 1924/2006 of the European Parliament and of the Council of 20 December 2006 on nutrition and health claims made on food. OJ L 404, 30.12.2006, pp. 9-25.
4. Regulation (EU) No 1169/2011 of the European Parliament and of the Council of 25 October 2011 on the provision of food information to consumers, amending Regulations (EC) No 1924/2006 and (EC) No 1925/2006 of the European Parliament and of the Council, and repealing Commission Directive 87/250/EEC, Council Directive 90/496/EEC, Commission Directive 1999/10/EC, Directive 2000/13/EC of the European Parliament and of the Council, Commission Directives 2002/67/EC and 2008/5/EC and Commission Regulation (EC) No 608/2004. OJ L 304, 22.11.2011, pp. 18-63.
7.3 News about Codex and regulatory affairs
Hertha Deutsch
AOECS Codex Delegate, Vienna, Austria
Introduction
AOECS, the Association Of European Coeliac Societies, comprises today 38 coeliac societies from 34 countries. The main objectives of AOECS are offering any advise and assistance to small and recently formed coeliac societies on how to establish a society and working for greater awareness of gluten intolerance to enlarge the variety of gluten-free foods in Europe.
The most important work of AOECS had already been concluded in the past years: AOECS participated very actively in the elaboration and modification of all world-wide Codex Standards and Guidelines for labelling of foods for normal consumption, genetically modified foods and special dietary foods. [1]. Because Codex Standards are regulating the world-wide trade, consequently national and EU-food legislations were also modified to comply with Codex Standards [1].
However, in the recent sessions of the Codex Committee on Methods of Analysis and Sampling (CCMAS) some delegations raised concern about the R5-method for determination of gluten in foods and particularly regarding the Type I classification because of proprietary aspects. [2].
Codex Committee on Methods of Analysis and Sampling
At the session in March 2012, Item 5 of the Agenda was “Provisions on the use of proprietary methods in Codex Standards” [3]. Methods in Codex Standards are primarily intended as international methods for the verification of provisions in Codex Standards. They should be used for reference, in calibration of methods in use or introduced for routine examination and control purposes. The Methods of Analysis comprises 4 Types: Defining Methods (Type I), Reference Methods (Type II), Alternative Approved Methods (Type III) and Tentative Method (Type IV). The Type I Method is defined in the Procedural Manual as “a method which determines a value that can only be arrived at in terms of the method per se and serves by definition as the only method for establishing the accepted value of the item measured.” [4].
After some discussions and several modifications of a drafted text the Committee elaborated the following definition:
Definition of a Proprietary Method of Analysis
For Codex purposes a proprietary method of analysis is one that contains protected intellectual property preventing full disclosure of information about the method and/or where the intellectual property owner restricts the use or distribution of the method or materials for its performance such that no alternative source of these would be available. It does not extend to a method which is subject only to copyright.
Requirements
Codex Committees may occasionally submit methods of analysis which are proprietary, or are based on proprietary aspects, to the Codex Committee on Methods of Analysis and Sampling for endorsement. CCMAS encourages the method sponsors to provide data for CCMAS assessment.
a) A proprietary method should not be endorsed if there is available a suitable non-proprietary method of analysis which has been or could be endorsed and which has similar or better performance characteristics. This should ensure that no approach is taken such that it appears as if a proprietary method is endorsed by Codex to the detriment of other potential methods; if possible preference should be given to adopting appropriate method criteria rather than endorsing a specific proprietary method of analysis.
b) Preference should be given to endorsing those methods of analysis where the reagents and/or apparatus are described in the method to the degree that either laboratories or other manufacturers could produce them themselves.
c) Method performance criteria established for proprietary methods are the same as those for non-proprietary methods. Performance criteria should be those stipulated above. If appropriate, information on the effect of manufacturing variability of the proprietary method on the method performance should be provided.
d) After endorsing, any changes that influence performance characteristics must be reported to CCMAS for consideration.
e) A proprietary method should be either fully collaboratively validated or validated and reviewed by an independent third party according to internationally recognised protocols. The results of such studies should be made available for CCMAS. If a proprietary method has not been validated by a full collaborative trial, it may be eligible for adoption into the Codex system as a Codex Type IV method, but not as a Type I, II or III method.
f) Whilst respecting the necessity for reasonable protection of intellectual property, sufficient information should be available to enable reliable use of the method by analysts and to enable evaluation of the performance of the method by CCMAS. In any particular case this may extend beyond performance data, for example to include details of operating principle, at the sole discretion of CCMAS.
g) The supplier or submitter of a proprietary method should demonstrate to CCMAS’s satisfaction that the method will be readily available to all interested parties.
h) CCMAS may decline to endorse a proprietary method if restrictions by intellectual property unduly restrict research into determining the method properties, scope of claim and validity or development of improvements to the technology.
i) If suitable nonproprietary methods become available and endorsed, the status of the previously endorsed proprietary method should be reviewed and may be revised.
The Codex Committee on General Principles approved this text in April 2012 and in July 2012 the Codex Alimentarius Commission adopted this text for inclusion in the Procedural Manual.
During the discussions in CCMAS, AOECS raised concern about two important issues which might result in confusing situations in terms of food labelling and asked for clarification. This could be achieved and published in the CCMAS Report [3]:
“65 The Committee noted in the absence of any other method, consideration should be given to adequate proprietary methods as at least one method of analysis should be endorsed to enforce labelling, such as in the case of gluten determination.
67 With regard to a question on how to deal with more than one proprietary method to be submitted for one provision, the Committee noted that they should be endorsed as type III and one of them would be type II if they would give the same analytical value and that only one of them should be endorsed as type I in case that they would give different values.”
European Commission
In June 2011 AOECS was informed about the work of the European Commission revising the legislation of dietetic foods and in doing so to repeal the Commission Regulation (EC) 41/2009 “concerning the composition and labelling of foodstuffs suitable for people intolerant to gluten”. The European Commission intended to regulate the requirements for 41/2009 under Regulation (EC) 1924/2006 which sets requirements on nutrition and health claims. Because of the lobbying from coeliac societies at national level and AOECS on international level the Regulation 41/2009 was not repealed in 2011 and AOECS was successful to prevent that the gluten-free issue will be regulated in 1924/2006 which would have caused several very negative aspects.
The new proposal from EU Commission suggests to regulate the composition and labelling of foodstuffs suitable for people intolerant to gluten in the Regulation (EU) 1169/2011 “on the provision of food information to consumers”, which shall apply from 13 December 2014. A majority in the EU Council members agreed to this proposal. However, a majority in the European Parliament did not support this proposal but instead supported gluten-free regulation going into the new framework “on foods intended for infants and young children and on foods for special medical purposes”. In September 2012 AOECS agreed to support the new Commission’s proposal to move the Regulation 41/2009 in the Regulation 1169/2011 provided that the content of 41/2009 must be completely covered by 1169/2011.
AOECS Projects
A very important project of AOECS is to launch and to disseminate the knowledge of the European Licensing System and to inform the food producers accordingly. The Crossed Grain Symbol has been used for already 40 years on gluten-free food products but applying with various national legislations regarding definitions and thresholds for “gluten-free”. With the adoption of the revised “Codex Standard for foods for special dietary use for persons intolerant to gluten” in July 2008 and the EU-Regulation 41/2009 legal issues have been harmonised and the European Licensing System for the use of the Crossed Grain Symbol could be published. A registration system was developed to avoid any not permitted use of the Symbol and national coeliac societies are responsible for licensing the Symbol according to the rules of the AOECS Charta.
Further AOECS projects are to start a gluten-free eating out project, to lobby for gluten-free food in airplanes, to continue networking with coeliac societies beyond Europe and to determine an International World Coeliac Day.
Conclusion
The working areas of AOECS are becoming more and more comprehensive and AOECS will continue to improve the life for coeliacs in all legal and practical aspects.
References
1. Hertha Deutsch, 20 years AOECS. In: Stern M (ed): Proceedings of the 23rd Meeting, Working Group on Prolamin Analysis and Toxicity. Verlag Wissenschaftliche Scripten, Leipzig, 2008; pp. 125-137.
2. Hertha Deutsch, AOECS. In: Stern M (ed): Proceedings of the 24th Meeting, Working Group on Prolamin Analysis and Toxicity, Verlag Wissenschaftliche Scripten, Leipzig, 2010; pp.103-105.
3. Report of the 33rd session of the Codex Committee on Methods of Analysis and Sampling, 5-9 March 2012, Budapest, Hungary, pp. 7-8 and p.39
4. Codex Alimentarius Commission, Procedural Manuel, Twentieth edition, p. 63
8 Perspectives and action plan of the PWG
Peter Koehler
German Research Centre for Food Chemistry, Freising, Germany
The Prolamin Working Group executive meeting and joint discussion held on September 22, 2012 led to the decisions outlined below.
Action plan
I. Analytical
• PWG offers its advice for collaborative studies on gluten detection. Companies must be the initiative party and should provide money and manpower to get he studies running.
• Peter Koehler is now responsible for the PWG gliadin reference material (Peter.Koehler@tum.de). PWG gliadin will continue being the reference material supported by the group. The group is open for studies on new reference materials.
• Studies on gluten quantitation will go on (immunochemical and non-immunochemical; deamidated). A collaborative study on the performance of the G12 antibody has been initiated and will be performed in 2013.
II. Clinical
• Studies on mechanisms of innate immunity and gluten sensitivity are a focus in the next years.
• The new ESPGHAN-guidelines for diagnosis of coeliac disease need to be discussed extensively (Symposium in the 2013 meeting)
• Refractory coeliac disease requires attention in the near future.
III. Publication and policy
• Prof. Knut Lundin (Oslo, Norway) has been suggested as a new group member and will be invited to the 2013 meeting.
• The PWG homepage was re-constructed and re-launched. Some improvements will be made in 2013.
• This printed, citable book (print run: 500 copies with ISBN number) was made possible by funding of Dr. SCHÄR GmbH/Srl, (Burgstall, BZ, Italy) and by the help of Mrs. Anneliese Stoiber and Dr. Gaby Andersen, Deutsche Forschungs-anstalt für Lebensmittelchemie (Freising, Germany). It will be distributed among leaders of opinion in gluten analysis and clinical medicine.
Next meeting: 2013
We are very pleased to announce the venue for our meeting in 2013:
Darmstadt, Germany
Host:
Dr. Sigrid Haas-Lauterbach
R-Biopharm AG
An der neuen Bergstraße 17
64297 Darmstadt, Germany
Phone +49-6151-81023-74
Telefax +49-6151-8102-40
Email: info@r-biopharm.de
Time: October 10 - 12, 2013
Focus of the meeting:
• Diagnosis of coeliac disease (ESPGHAN-guidelines, diagnosis in children, diagnosis in adults)
• Gluten analysis (immunochemical and non-immunochemical; deamidated)
The meeting will be limited to 50 participants and attendance is by
invitation only. Invitations will be sent by April 2013. Registration
deadline will be July 1, 2013.
For registration please contact:
Judith Suck
Deutsche Zöliakie-Gesellschaft e.V. (DZG)
Kupferstraße 36
70565 Stuttgart, Germany
Phone: +49-711-459981-13
Fax: +49-711-459981-50
E-Mail: judith.suck@dzg-online.de
Very special thanks to the host of this kind invitation!
|
|
List of Participants
GROUP MEMBERS
Prof. Dr. Carlo Catassi
Università politecnica delle marche Facoltà di Medicina e Chirurgia
Istituto di Clinica Pediatrica
Via Corridoni 11 - 60123 ANCONA, IT ALY
Phone +39 349 2235 447 | Tele fax +39 071 36281
Email: catassi@tin.it
Prof. Dr. Fernando G. Chirdo
Laboratorio de Investigación en el Sistema Inmune (LISIN)
Facultad de Ciencias Exactas Universidad Nacional de La Plata cc 711
(1900) LA PLATA, ARGENTINA
Phone: +54 221 421 0 497 | 423 0 121 | 423 5 333 (Int 45)
Tele fax +54 221 422 6947
Email: fchirdo@biol.unlp.edu.ar
Prof. Paul J. Ciclitira
King's College London (Division of Diabetes and Nutritional Sciences) The Rayne Institute (KCL). St Thomas' Hospital Westminster Bridge Road. LONDON SE1 7EH, UK/ENGLAND
Phone: +44 207 620 2597 | 207 188 2494 | Telefax +44 207 261 0667
Email: mila.labar_weintrop@kcl.ac.uk (secretary)
Email: paul.ciclitira@kcl.ac.uk
Prof. Conleth Feighery, MD
(not at tend ing)
University of Dublin Department of Immunology St. James's Hospital James's Street DUB LIN 8, IRELAND
Phone: +353 1 896 3432 | Tele fax +353 1 4545-609
Email: con.feighery@tcd.ie
Dr. Luud Gilissen
Plant Research International (PRI) Wageningen University
Droevendaalsesteeg 1 6708 PB WAGENINGEN, THE NETHERLANDS
Phone: +31 317-480983 | Fax: +31 317-418094
Email: luud.gilissen@wur.nl
Prof. Dr. Peter Köehler
Deut sche Forschungsanstalt für Lebensmittelchemie
Lise-Meitner-Straße : +34 - 85354
FREISING, GER MANY
Phone: +49 81 61 71 29 28 | Tele fax +49 81 61 71 29 70
Email: peter.koehler@tum.de
Prof. Dr. Frits Koning
Leiden Univer sity Medical Center, E3-Q
Department of Immunohaematology and Bloodbank Albinusdreef 2
2333 ZA LEIDEN, THE NETHERLANDS
Phone: +31 71 5266673 | Tele fax +31 71 5265267
Email: fkoning@lumc.nl
Prof. Dr. Thomas Mothes
Universitätsklinikum Leip zig A. ö. R.
Institut für Laboratoriumsmedizin, Klinische Chemie und Molekulare Diagnostik - Liebigstraße : 27 - 04103
LEIPZIG, GERMANY
Phone: +49 341 97 22251 | Tele fax +49 341 97 22329
Email: mothes@medizin.uni-leipzig.de
Prof. Dr. Dr. Detlef Schuppan
I. Medizinische Klinik und Poliklinik Universitätsmedizin der Johannes
Gutenberg-Universität Mainz Langenbeckstr. 1,55131 MAINZ, GERMANY
Phone +49 6131-177355/ 177356/177104 - Fax +49 6131-177357
Email: detlef.schuppan@unimedizinmainz.de
Prof. Dr. Martin Stern
Universitätsklinik für Kinder- und Jugendmedizin Hoppe-Seyler-Straße 1
72076 TÜBINGEN, GER MANY
Phone: +49 7071 29 83781 | Tele fax +49 7071 29 5477
Email: martin.stern@med.uni-tuebingen.de
Prof. Dr. Riccardo Troncone (not attending)
Department of Pediatrics and European Laboratory for the Investigation of Food-induced Diseases University of Naples “Federico II”- via Pansini, 5 - 80131 NAPLES, ITALY
Phone: +39 081 7463383 | Telefax +39 081 5469811
Email: troncone@unina.it
Dr. Renate van Eckert
Victo ria Univer sity of Wellington
Centre of Biodiscovery and School of Biological Sciences
P.O. Box 600 WELLINGTON, NEW ZEA LAND
Phone: +64 4 463 6092 | Tele fax +64 4 463 5331
Email: renate.vaneckert@gmail.com
HOSTS
Dr. Inge Celus
Vlaamse Coeliakievereinigung vzw (VCV) and Laboratory of
Food Chemistry and Biochemistry / Leuven Food Science and Nutrition Research Centre2 (LFoRCe)2
Katholieke Universiteit Leuven
Kasteelpark Arenberg 20 box 2463
BE-3001 LEUVEN, BELGIUM
Phone: +32 16 321627
Fax: +32 16 321997
Email: inge.celus@biw.kuleuven.be
Dr. Kurt Gebruers
Vlaamse Coeliakievereinigung vzw (VCV) and Laboratory of
Food Chemistry and Biochemistry / Leuven Food Science and Nutrition Research Centre2 (LFoRCe)2
Katholieke Universiteit Leuven
Kasteelpark Arenberg 20 box 2463
BE-3001 LEUVEN, BELGIUM
Phone: +32 16 321627
Fax: +32 16 321997
Email: kurt.gebruers@biw.kuleuven.be
INVITED SPEAKERS
Dr. Michael Abbott
Health Canada
251 Sir Frederick Bauting Driveway
K1AOK9 OTTAWA, CANADA
Phone: +16139570949
Fax: +16139901543
Email: michael.abbott@hc-sc.gc.ca
Dr. Olivier Tranquet
INRA
Rue de la Géraudière
44316 NANTES, FRANCE
Phone: +33 240675027
Fax: +33 240675025
Email: tranquet@nantes.inra.fr
GUESTS
Mr. Gunnar Adas
Fria Gluten Free
Fältspatsgatan 12
42130 VÄSTRA FRÖLUNDA, SWEDEN
Phone: +46 708684852
Fax: +46 317341335
Email: gunnar@fria.se
Mrs. Sofia Beisel
Deutsche Zöliakie Gesellschaft eV
Kupferstr 36
70565 STUTTGART, GERMANY
Phone: +49 71145998115
Fax: 49 71145998150
Email: sofia.beisel@dzg-online.de
Dr. Markus Brandt
Ernst Böcker GmbH & Co. KG
Ringstrasse 55-57
32427 MINDEN, GERMANY
Phone: +49 5718379943
Fax: +49 5718379920
E-Mail: markus.brandt@sauerteig.de
Dr. Kristof Brijs
KU Leuven
Kasteelpark Arenberg 20
3000 LEUVEN, BELGIUM
Phone: +32 16 321634
Fax: +32 16 321997
Email: kristof.brijs@biw.kuleuven.be
Dr. Helen Brown
Campden BRI
Station Road, Chipping Campden
GL556LD GLOUCESTERSHIRE, UK
Phone: +44 1386842016
Fax: +44 1386842100
Email: h.brown@campden.co.uk
Dr. Virna Cerne
Dr. Schär AG/SPA
Winkelau 9
39014 POSTAL, ITALY
Phone: +39 403755380
Fax: +39 403755385
Email: arianna.grabbio@drschaer.com
Prof. Christophe Courtin
KU Leuven
Kasteelpark Arenberg 20
3000 LEUVEN, BELGIUM
Phone: +32 16 321634
Fax: +32 16 321997
Email: christophe.courtin@biw.kuleuven.be
Mrs. Hertha Deutsch
AOECS
Association of European Coeliac Societies-Codex and Regulatory Affairs
Anton Baumgartner Straße 44/C5/2302
1230 VIENNA, AUSTRIA
Phone: +43 1 66 71887
Fax: +43 1 66 71887
Email: hertha.deutsch@utanet.at
Mrs. Chantal Devue
Vlaamse Coeliakievereniging
Stationsstraat 5
9850 LANDEGEM, BELGIUM
Email: chantal.devue@telenet.be
Dr. Clyde Don
Foodphysica
Vogelwikke 12
6665 HP DRIEL THE NETHERLANDS
Phone: +31 622 543 047
Email: clyde.don@foodphysica.com
Mr. Christian Gösswein
R-Biopharm AG
An der neuen Bergstrasse 17
64297 DARMSTADT, GERMANY
Phone: +49 6151 810238
Fax: +49 6151 8102734
Email: c.goesswein@r-biopharm.de
Mrs. Gertrud Granel
Fachverband der Stärke-Industrie e.V.
Königstraße 57
56115 BONN, GERMANY
Phone: +49 30 8871 3398-15
Fax: +49 30 8871 3398-19
Email: g.granel@verbaende-jess.de
Dr. Sigrid Haas-Lauterbach
R-Biopharm AG
An der neuen Bergstrasse 17
64297 DARMSTADT, GERMANY
Phone: +49 6151 810225
Fax: +49 6151 810240
Email: s.h.lauterbach@r-biopharm.de
Mrs. Elisabeth Hammer
Romer Labs Division Holding GmbH
Technopark 1
3430 TULLN, AUSTRIA
Phone: +43 66488628249
Fax: +43 227261533111
Email: elisabeth.hammer@romerlabs.com
Dr. Reka Haraszi
EC JRC IRMM
Retieseweg 111
2440 GEEL, BELGIUM
Phone: +32 14571967
Fax: +32 14584273
Email: reka.haraszi@ec.europa.eu
Prof. Dr. Martin Hiele
UZ Leuven
Herestraat 49
3000 LEUVEN, BELGIUM
Phone: +32 16344225
Fax: +32 16344419
Email: martin.hiele@uzleuven.be
Dr. Ulrike Immer
R-Biopharm AG
An der neuen Bergstrasse 17
64297 DARMSTADT, GERMANY
Phone: +49 6151 810238
Fax: +49 6151 8102734
Email: u.immer@r-biopharm.de
Dr. Päivi Kanerva
Department of Food and Evironmental
Sciences
P.O. Box 66
Agnes Sjöbergin katu 2
00014 UNIVERSITY OF HELSINKI
HELSINKI, FINLAND
Phone: +358 9 191 58236
Fax: +358 9 191 58460
Email: paivi.kanerva@helsinki.fi
Mrs. Verena Knorr
Dt. Forschungsanstalt
für Lebensmittelchemie
Lise-Meitner-Straße 34
85354 FREISING, GERMANY
Phone: +49 08161 71 2926
Fax: +49 08161 71 2970
Email: Verena.Knorr@lrz.tum.de
Mrs. Katharina Konitzer
Deutsche Forschungsanstalt für Lebensmittelchemie
Lise Meitner-Strasse 34
85354 FREISING, GERMANY
Phone: +49 8161712978
Fax: +49 8161712970
Email: katharina.konitzer@tum.de
Dr. Götz Kröner
Hermann Kröner GmbH
Postfach 1354
49463 IBBENBÜREN, GERMANY
Phone: +49 545194470
Fax: +49 545194439
Email: kroener@kroener-staerke.de
Dr. Bert Lagrain
KU Leuven
Kasteelpark Arenberg 20
3000 LEUVEN, BELGIUM
Phone: +32 16 321634
Fax: +32 16 321997
Email: bert.lagrain@biw.kuleuven.be
Mrs. Colette Larre
INRA-BIA
Rue de la Géraudière
44300 NANTES, FRANCE
Phone: +33 240675131
Email: larre@nantes.inra.fr
Mrs. Stella Lindeke
R-Biopharm AG
An der neuen Bergstrasse 17
64927 DARMSTADT, GERMANY
Phone: +49 6151 810292
Fax: +49 6151 810240
Email: s.lindeke@r-biopharm.de
Mrs. Norma Mc Gough
Coeliak UK
3rd Floor Apollo Center
Desborough Road HP11 2QW
HIGH WYCOMBE, BUCKINGHAMSHIRE, UK
Phone: +44 1494796135
Fax: +44 1494474349
Email: norma.mcgough@coeliac.org.uk
Dr. Maria Carmen Mena Valverde
Centro Nacional de Biotechnologia, CSIC
C/ Darwin 3
28049 MADRID, SPAIN
Phone: +34 915854670
Fax: +34 915854506
Email: mcmena@cnb.csic.es
Dr. Luisa Novellino
AIC - Italian Society of Coeliac Disease
Via Caffaro 10
16124 GENOVA, ITALY
Phone: +39 0103012747
Fax: +39 0108449404
Email: lnovellino@celiachia.it
Prof. Roland Poms
International Association for
Cereal Science and Technology
Marxergasse 2
1030 VIENNA, AUSTRIA
Phone: +43 170 772020
Fax: +43 170 772040
Email: roland.poms@icc.or.at
Mrs. Catherine Remillieux-Rast
AFDIAG
Rue de Venise 23
78740 VAUX-SUR-SEINE, FRANCE
Phone: +33 681270911
Fax: +33 130993668
Email: c.remillieux_rast@yahoo.fr
Dr. Martin Salden
Eurodiagnostica
Weezenhof 8049
6536 CL NIJMEGEN
THE NETHERLANDS
Phone: +31 622258028
Email: martin.salden@eurodiagnostica.nl
Prof. Hannu Salovaara
University of Helsinki
Agnes Sjöbergin katu 2
P.O. Box 66
FI-00014 HELSINKI, FINLAND
Phone: +35 89191 58235
Fax: +35 89191 58460
Email: hannu.salovaara@helsinki.fi
Mr. Ron Sarver
Neogen Corp.
Lesher Place 620
MI 48912 LANSING, USA
Phone: +1 517 372 9200
Email: rsarver@neogen.com
Dr. Juan Ignacio Serrano-Vela
Asociacion de Celiacos de Madrid
Calle Lanuza 19-bajo
28028 MADRID, SPAIN
Phone: +34 690202696
Fax: +34 917258059
Email: nachoserrano@celiacosmadrid.org
Dr. Ylva Sjögren Bolin
National Food Agency
P.O. Box 622
SE-751 26 UPPSALA
SCHWEDEN
Phone: +46 18 171416
Fax: +46 18 105848
Email: ylva.sjogren@slv.se
Mrs. Pauline Titchener
Neogen Europe ltd
The Dairy School, Auchincruive
KA6 5HW AYR, SCOTLAND, UK
Phone: +44 1292 525 610
Fax: +44 1292 525 602
Email: p.titchener@neogeneurope.com
Mrs. Katrien Verbiest
Vlaamse Coeliakievereniging
Stationsstraat 5
9850 LANDEGEM, BELGIUM
Email: katrien_verbiest@hotmail.com
Dr. Thomas Weiss
R-Biopharm AG
An der neuen Bergstrasse 17
64297 DARMSTADT, GERMANY
Phone: +49 6151 8102 186
Email: t.weiss@r-biopharm.de
Mrs. Maren Wiese
Hermann Kröner GmbH
Postfach 1354
49463 IBBENBÜREN, GERMANY
Phone: +49 545194470
Fax: +49 545194439
Email: wiese@kroener-staerke.de
Prof. Dr. Myriam Van Winckel
UZ Gent 3K12D
De Pintelaan 185
9000 GENT, BELGIUM
Phone: +32 93323590
Fax: +32 93322170
Email: myriam.vanwinckel@uzgent.be
Mrs. Lisbeth Witt
Eurodiagnostica
Box 50 117
212 11 MALMÖ, SWEDEN
Phone: +46 40537600
Email: lisbeth.witt@eurodiagnostica.se
Impressum
Proceedings of the 26th Meeting
WORKING GROUP
on PROLAMIN ANALYSIS and TOXICITY
September 20 – 22, 2012
Leuven, Belgium
This work including all parts is subject to copyright. All rights are reserved and any utilisation is only permitted under the provisions of the German Copyright Law.
Permissions for use must always be obtained from the publisher. This is in particular valid for reproduction, translation, conversion to microfilm and for storage or processing in electronic systems.
Scientific Organisation
Prof. Dr. Peter Köhler
Deutsche Forschungsanstalt für Lebensmittelchemie
Lise-Meitner-Str. 34, 85354 FREISING, GERMANY
Phone: +49 8161 712928; Telefax +49 8161 712970
Email: peter.koehler@tum.de
Host
Vlaamse Coeliakievereinigung vzw (VCV) and Laboratory of
Food Chemistry and Biochemistry / Leuven Food Science and Nutrition
Research Centre (LFoRCe)
Katholieke Universiteit Leuven
Kasteelpark Arenberg 20, box 2463, BE-3001 Leuven, Belgium
Phone: +32 16 321627; Telefax: +32 16 321997
Email: inge.celus@biw.kuleuven.be/kurt.gebruers@biw.kuleuven.be
http://www.lforce.kuleuven.be
Cover picture
Thomas Mothes
© Verlag Deutsche Forschungsanstalt für Lebensmittelchemie (DFA)
Lise-Meitner-Strasse 34, 85354 Freising
Phone: +49 8161 712928
www.dfal.de
ISBN: 978-3-938896-66-2
|


